FSD-Motors

    Mastering Reporting & Analytics in Atera

    Anas Abdu Rauf
    October 18, 2025
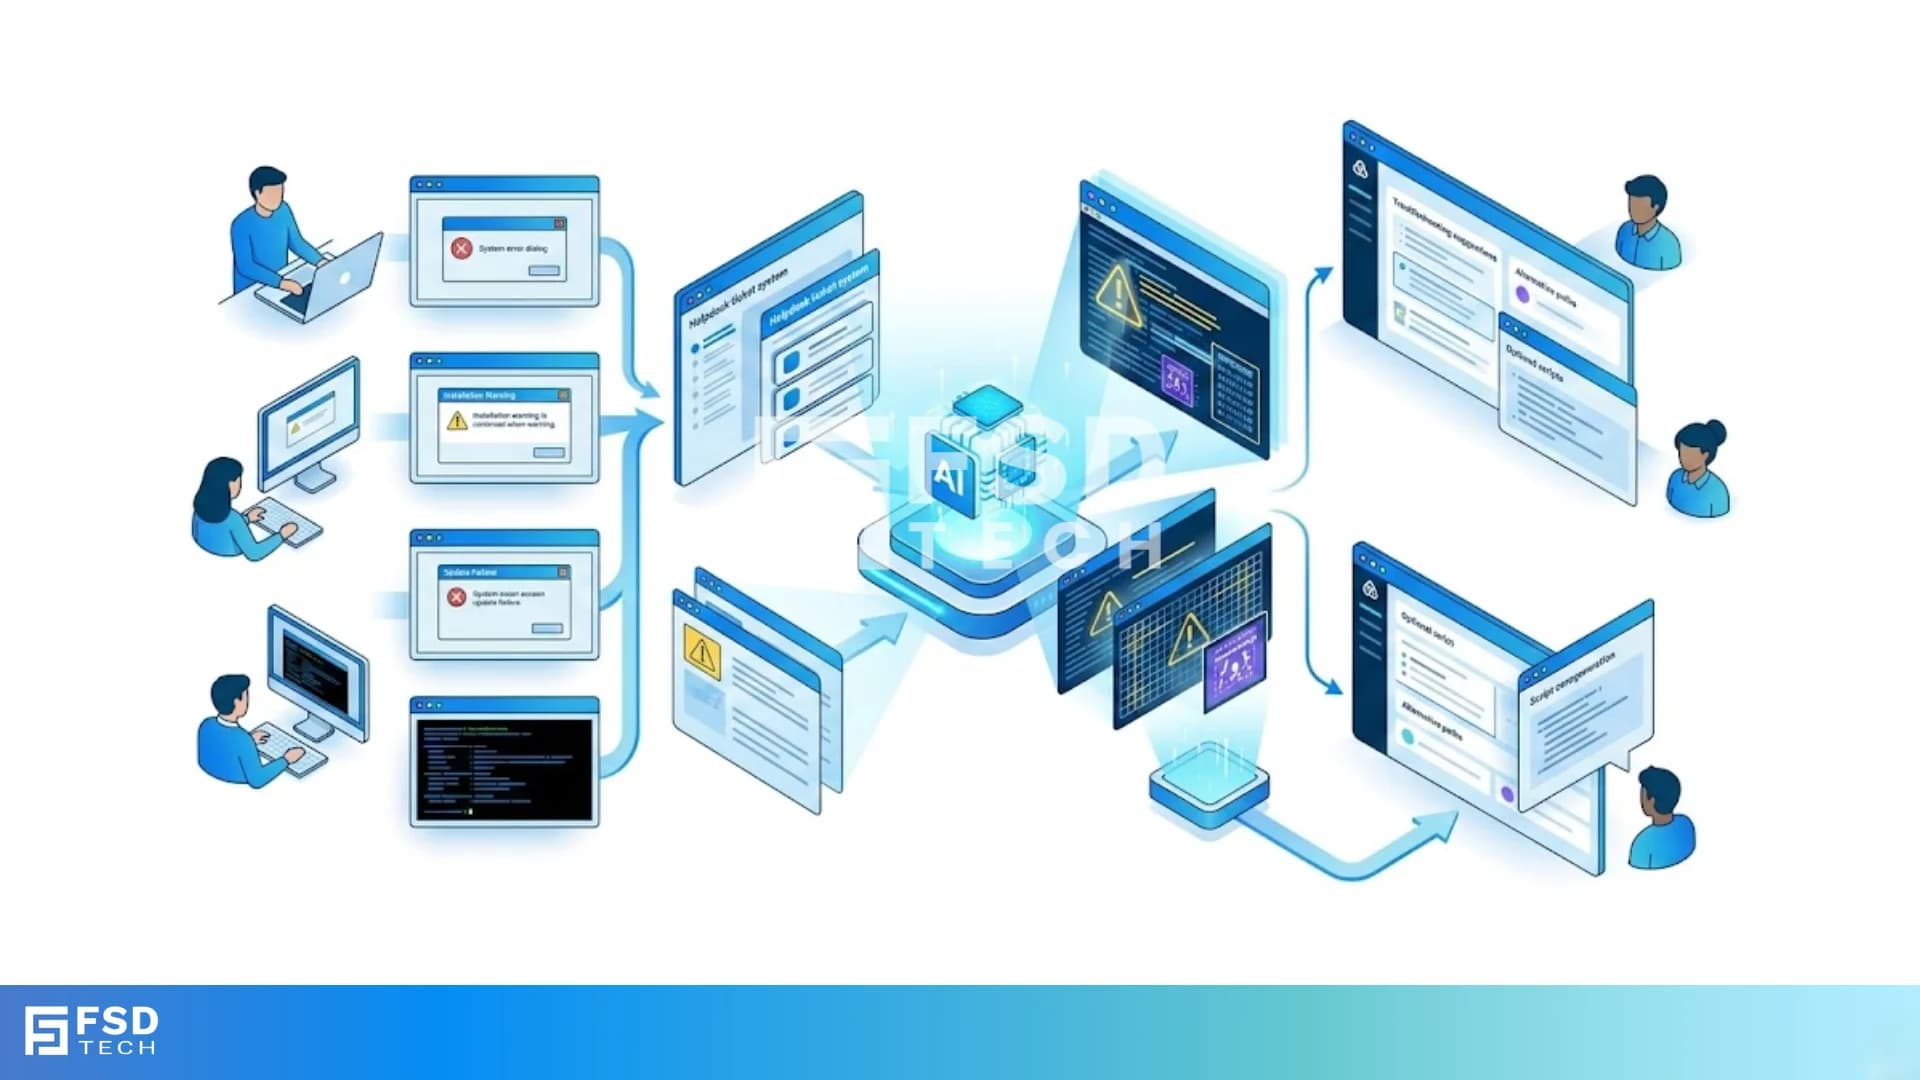
    3D-style isometric illustration showing an Atera analytics dashboard with charts, graphs, and metrics connected to data sources. Depicts team members reviewing IT performance data through digital screens labeled CSV and Reports, representing integrated analytics and automation. Blue gradient theme with FSD Tech logo at bottom. SEO keywords: Atera analytics visualization, IT reporting automation, RMM PSA dashboard, FSD Tech Atera integration.

    Introduction

    Data-driven insights are essential for proactive IT management and business alignment. Atera’s robust Reporting & Analytics suite—spanning RMM, PSA, and patch management—puts customizable, exportable reports at your fingertips. Whether you need real-time device health dashboards, monthly service invoices, or compliance metrics, Atera’s unified reporting platform delivers the right information to the right stakeholders. In this post, we’ll explore how to access, customize, and automate reports across Atera’s modules to drive operational excellence and strategic decision-making.


    Key Takeaways

    • Access Reports under the Reporting & Analytics sections in both RMM and PSA modules.
    • Prebuilt Reports cover device inventory, patch compliance, ticket metrics, and financial summaries.
    • Custom Analytical Reports let you define filters, groupings, and visualizations.
    • Automate Report Delivery via scheduled email to stakeholders.
    • Export & Integrate data in CSV or PDF for presentations, audits, or billing.


    1. Navigating Atera’s Reporting & Analytics Hub

    Outcome: Quickly find the report you need.

    • RMM Reporting: Go to Monitoring > Reporting & Analytics for device-centric dashboards (inventory, performance, patch status).
    • PSA Reporting: Under Tickets > Reports & Analytics, access service-level metrics, technician utilization, and billing summaries.
    • Unified Access: Both hubs offer search, favorites, and role-based permissions to ensure teams see only their relevant reports.
       

    2. Prebuilt Reports: Ready-Made Insights

    Outcome: Leverage Atera’s library of over 50 report templates.

    • Device Inventory: Lists hardware and software details across all agents.
    • Patch Compliance: Shows deployed vs. pending patches by device group.
    • Ticket Performance: Tracks ticket volume, resolution times, and SLA compliance.
    • Technician Utilization: Monitors billable vs. non-billable hours, time entries, and productivity.
    • Financial Summaries: Generates invoice-ready totals for time and materials.

    Job-to-Be-Done: An MSP director reviews monthly Technician Utilization and Financial Summary reports to validate client invoices and internal profitability.
     

    3. Building Custom Analytical Reports

    Outcome: Tailor data views to unique business questions.

    1. Navigate to Reports > Create Analytical Report.
    2. Choose a Data Source (Devices, Tickets, Time Entries, Alerts).
    3. Select Columns & Metrics, apply Filters (e.g., date range, customer, tag).
    4. Group by fields like Technician, Site, or Severity.
    5. Save as Private or Public template for reuse.
    6. Visualize with Charts, Tables, or Graphs.

    This flexibility lets you answer questions such as “Which clients had the highest SLA breaches last quarter?” or “What’s the average patch deployment time across regions?”
     

    4. Scheduling & Automating Report Delivery

    Outcome: Automate insights distribution with no manual effort.

    • In any saved report, click Schedule.
    • Set Frequency: hourly, daily, weekly, or monthly.
    • Choose Recipients: specific emails or user roles.
    • Select Format: PDF or CSV attachment.

    Automated delivery ensures executives and clients receive timely data without ad-hoc exports.
     

    5. Exporting & Integrating Report Data

    Outcome: Seamlessly bring Atera data into other tools.

    • CSV Export for spreadsheet analysis or BI tools (Power BI, Tableau).
    • PDF Export for board presentations or compliance archives.
    • API Access (for Enterprise customers) to pull raw report data directly into custom dashboards.

    By exporting to open formats, you maintain flexibility to integrate Atera insights into your broader data ecosystem.
     

    Build & Share Your First Report →

    Head to Monitoring > Reporting & Analytics (or Tickets > Reports & Analytics), pick a template, and click Create Analytical Report. Then, schedule it to land in your inbox automatically.

    Ready To Turn Data Into Decisions? Book A Free No-Obligation Call With Our Atera Experts Now.
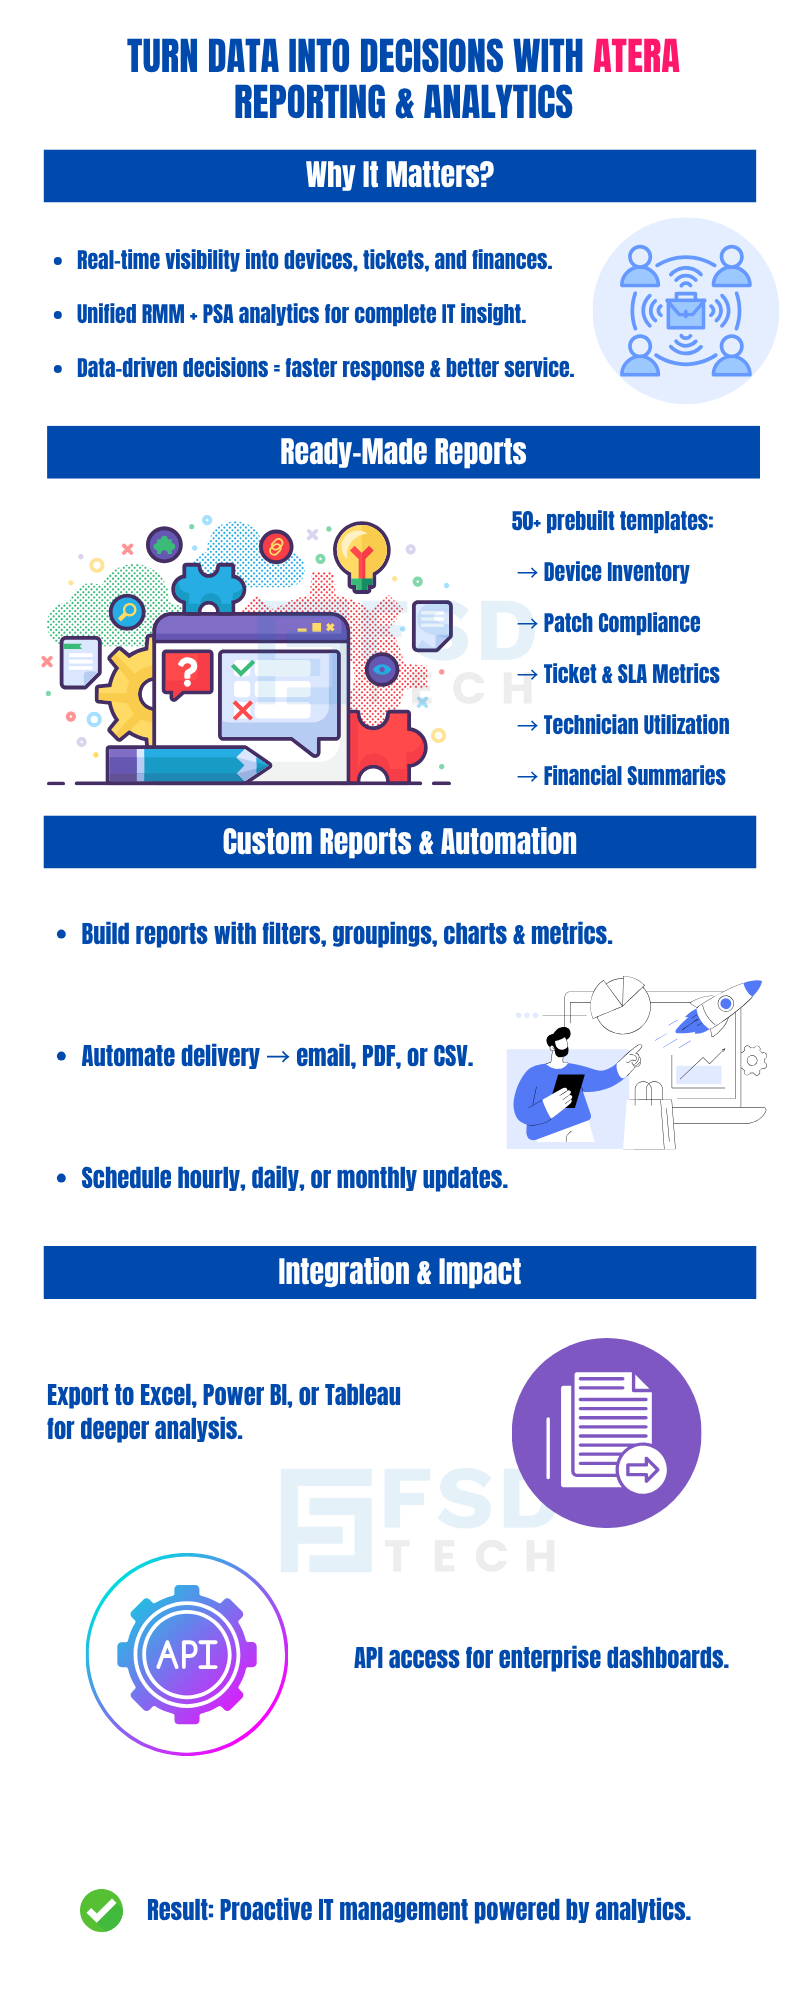
    Infographic explaining how Atera Reporting & Analytics helps IT teams turn data into decisions. Highlights real-time visibility across devices, tickets, and finances, unified RMM + PSA analytics, and over 50 prebuilt report templates for patch compliance, SLA metrics, and financial summaries. Mentions custom reports, automation, API access, and export to Excel, Power BI, or Tableau. Clean white background with colorful vector icons and FSD Tech branding. SEO keywords: Atera reporting, IT analytics dashboard, RMM PSA insights, automated IT reports, FSD Tech.

    FAQ 

    1. Where do I find RMM vs. PSA reports?

    RMM reports live under Monitoring > Reporting & Analytics; PSA reports are under Tickets > Reports & Analytics.
     

    2. How many prebuilt report templates are available?

    Over 50, covering inventory, patching, tickets, time entries, and financials.


    3. Can I schedule reports for automatic delivery?

    Yes—set frequency, recipients, and format (PDF or CSV) via the Schedule option on any report.


    4. Are custom reports shareable?

    Absolutely—save as Public to make available to your team, or Private for personal use.


    5. What export formats are supported?

    CSV and PDF exports are available on all reports; API access for advanced integrations.


    6. Can I pull report data into BI tools?

    Yes—export CSV for Excel, Power BI, or Tableau; enterprise plans include direct API endpoints.

    Mastering Reporting & Analytics in Atera

    About The Author

    Anas Abdu Rauf

    Anas is an Expert in Network and Security Infrastructure, With over seven years of industry experience, holding certifications Including CCIE- Enterprise, PCNSE, Cato SASE Expert, and Atera Certified Master. Anas provides his valuable insights and expertise to readers.

    Like This Story?

    Share it with friends!

    Subscribe to our newsletter!

    share your thoughts