.webp&w=3840&q=75)
How ClickUp Enables Outcome-Based Project Management (Not Just Task Tracking)
🕓 February 15, 2026
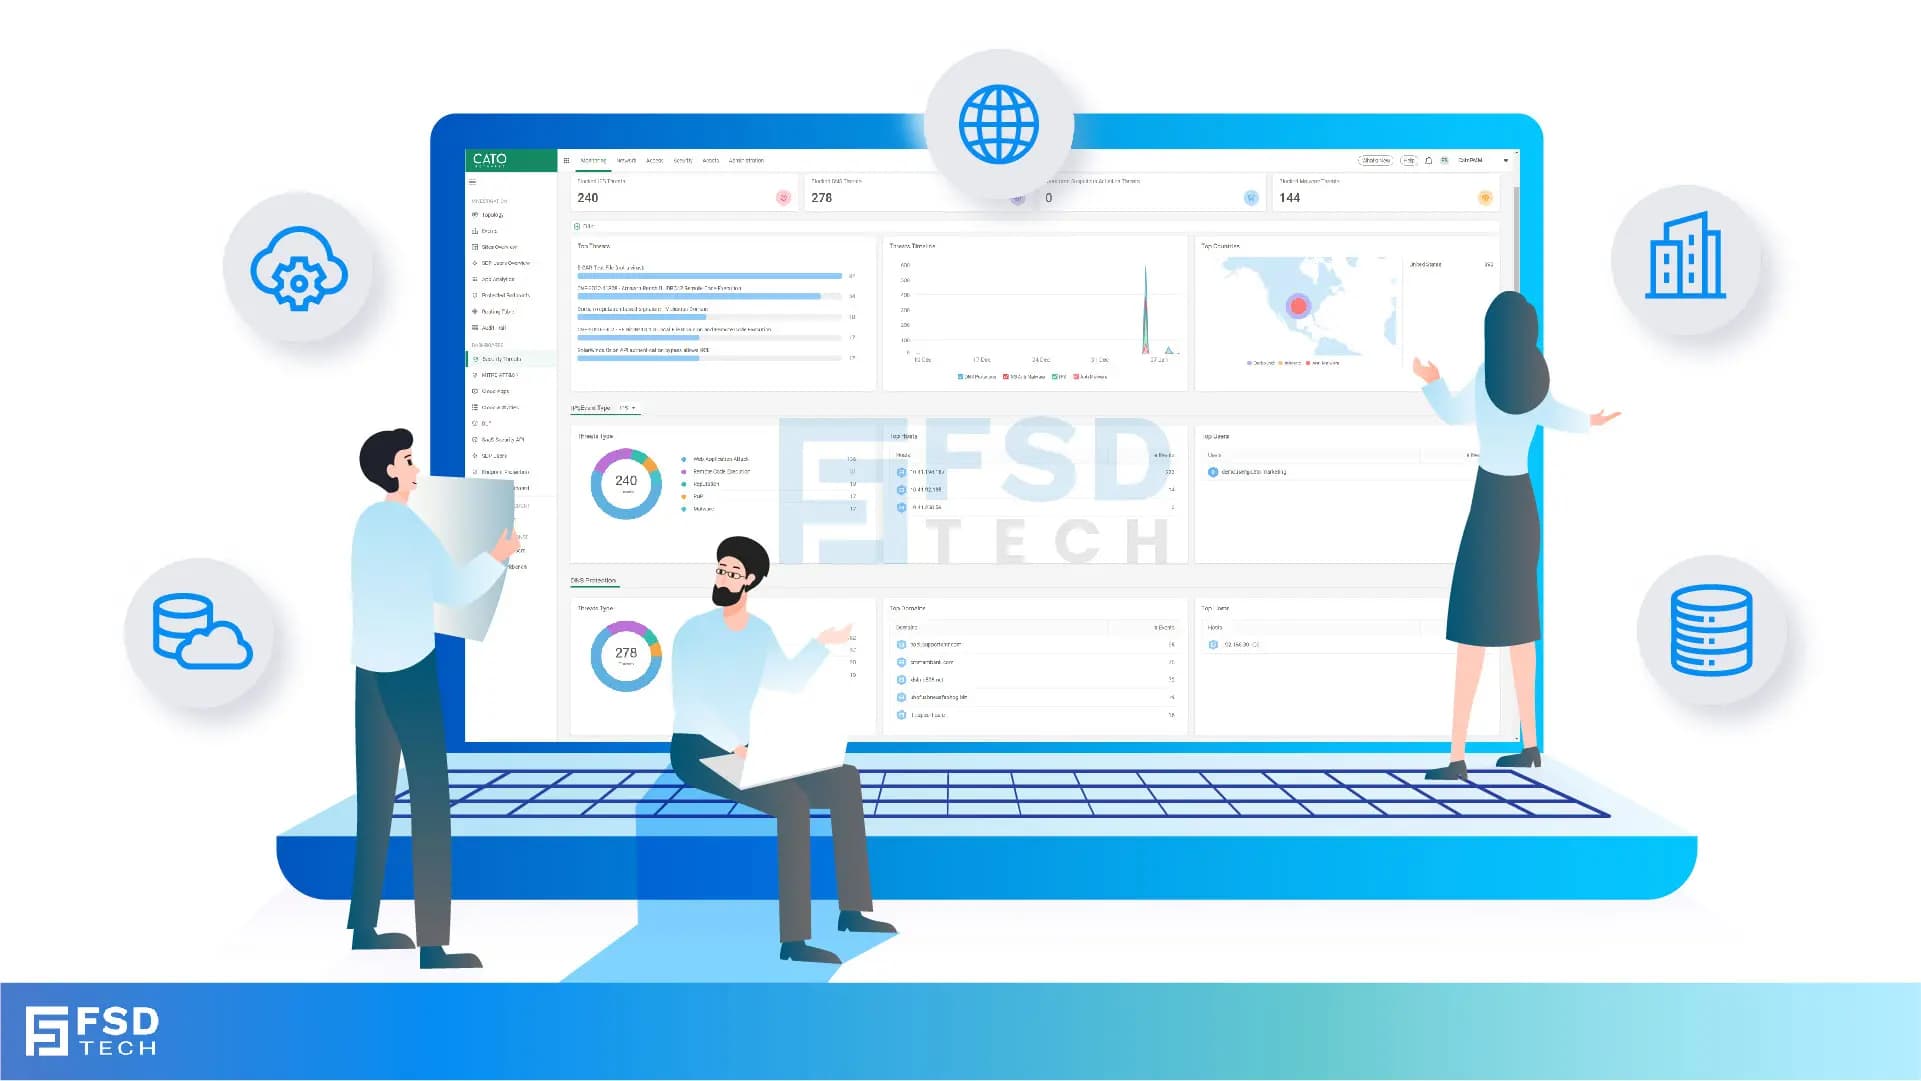
Cato Networks Application Visibility is a cloud-native monitoring capability that allows IT teams to identify, analyze, and manage all software traffic across the network. It uses deep packet inspection (DPI) to provide real-time data on bandwidth consumption, session counts, and user identity through a single management interface.
Have you ever wondered exactly what is eating up your bandwidth at 2:00 PM on a Tuesday? In my experience, it is rarely the business-critical ERP system you’d expect. Usually, it is a rogue update or a group of users streaming high-definition media. Without clear sight, you are basically flying blind. Cato Networks solves this by giving you a "God view" of every bit and byte moving through your pipes.
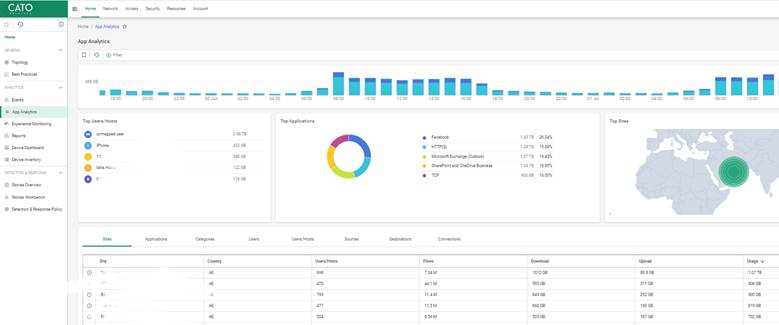
Cato's latest interface separates visibility from enforcement, making it easier to focus on the data you need.
You can access app usage insights via:
Also Read: How the Cato Client Becomes the Identity Anchor for Zero Trust Access
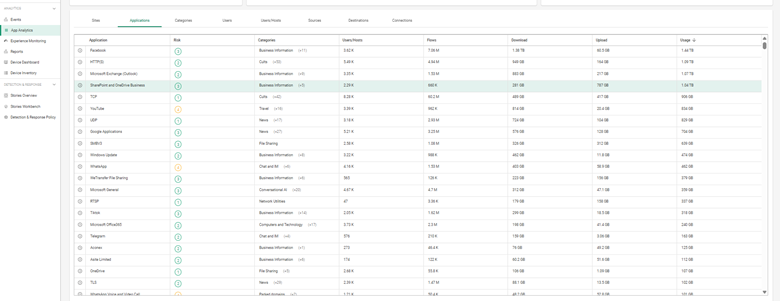
Cato’s cloud-native engine uses deep packet inspection (DPI) and behavioral heuristics to automatically identify over 5,000 applications.
Each app is tagged with:
Unknown or custom apps can also be flagged for further review, and admins can tag them as custom entries.

In the Application Analytics dashboard, focus on the following metrics:
A university's IT team noticed unexpected spikes in bandwidth from file-sharing apps. With Cato, they pinpointed usage to a handful of endpoints and adjusted policies accordingly to restrict them during peak hours.
You can sort apps by:
This helps uncover:
Once you’ve identified problematic or overused applications, you can take action:
Note: As of now, you cannot configure threshold-based alerts for individual application bandwidth/session usage directly from the Application Analytics dashboard.
Also Read: Platforms, Countries, and Origin of Connection: Advanced Device Criteria in Cato Firewall
Create baseline reports to monitor usage trends across time
Contact Our Cato SASE Specialist Today
Yes. It recognizes browser-accessed apps and web traffic.
Not directly—you’ll need to create a rule under Network Policies.
Yes. Cato maps traffic by identity and endpoint.
Cato leverages DPI and heuristics, giving high accuracy across thousands of known apps.
Yes. Use the REST API or scheduled report features for integration with third-party systems.

Anas is an Expert in Network and Security Infrastructure, With over seven years of industry experience, holding certifications Including CCIE- Enterprise, PCNSE, Cato SASE Expert, and Atera Certified Master. Anas provides his valuable insights and expertise to readers.
Share it with friends!


.webp&w=3840&q=75)


.webp&w=3840&q=75)
share your thoughts