.webp&w=3840&q=75)
How ClickUp Enables Outcome-Based Project Management (Not Just Task Tracking)
🕓 February 15, 2026

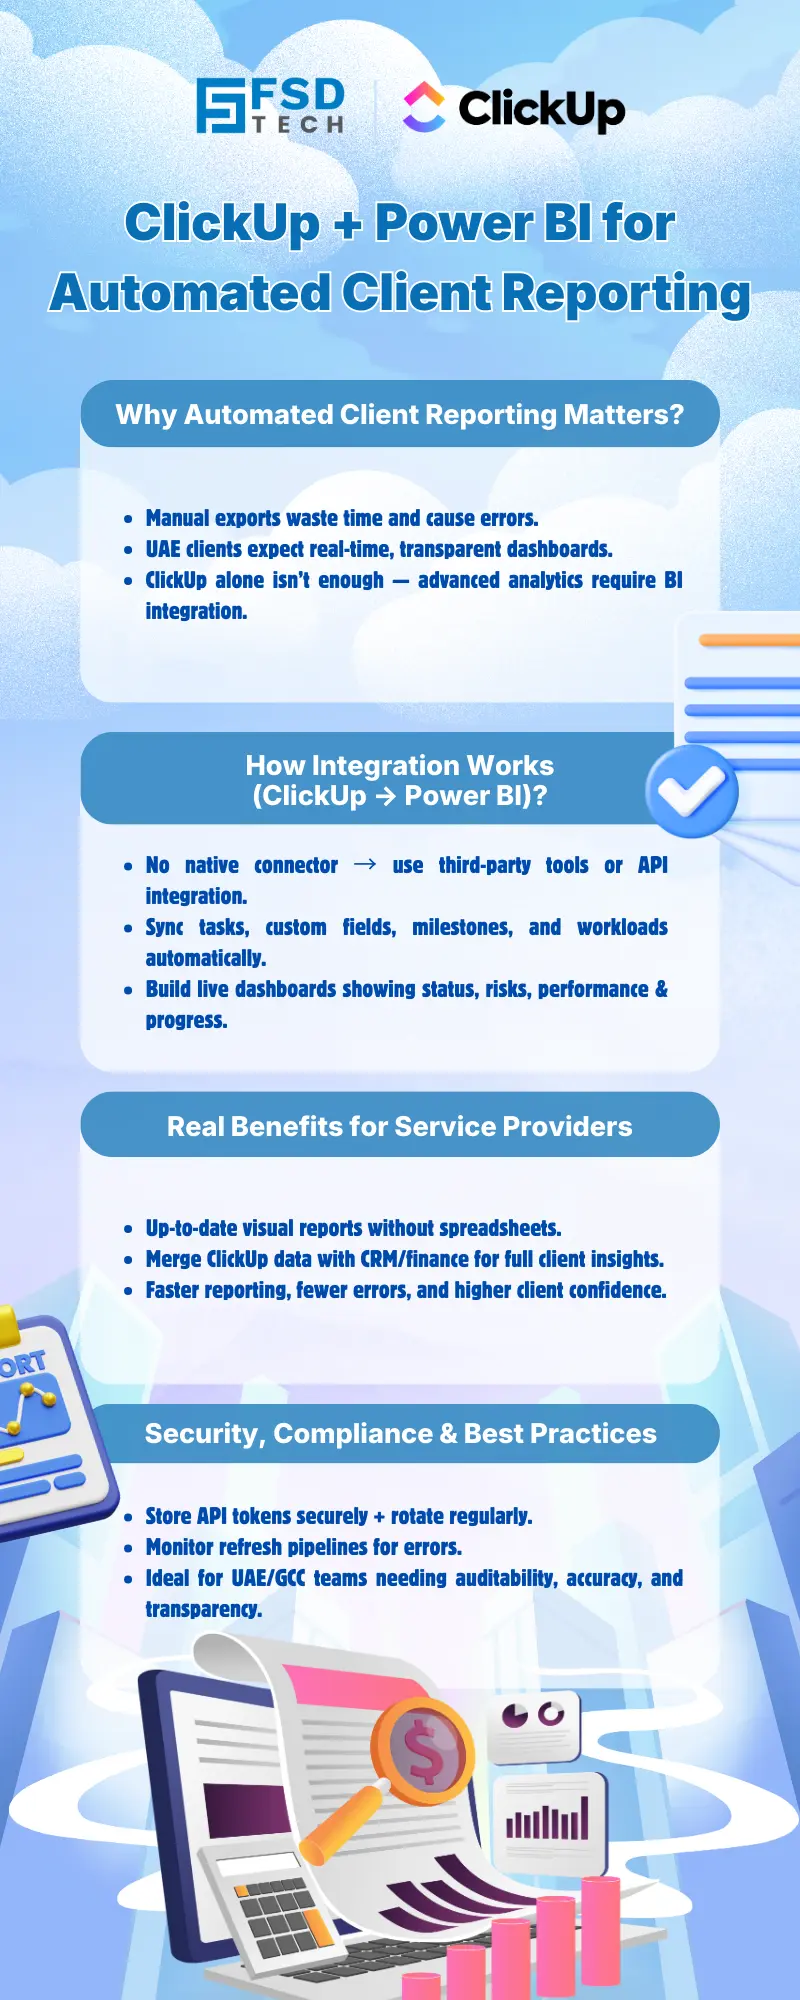
In the UAE’s competitive service sector, clients expect timely, transparent, and data-driven updates on project progress. Manual reporting is inefficient, prone to errors, and often fails to meet the expectations of modern clients who demand real-time insights. Automating client reports with visual dashboards:
ClickUp is a popular project management platform for UAE-based teams, but its native reporting features are limited for organizations seeking advanced analytics and automated client updates. Integrating ClickUp with Power BI unlocks the ability to deliver rich, interactive dashboards that scale with your client base.
Despite high demand from the ClickUp user community, there is currently no native ClickUp–Power BI connector . This limitation is particularly relevant for UAE service providers who require robust, automated reporting to meet client expectations and regional compliance standards. As a result, organizations must leverage third-party connectors or build custom API integrations to bridge the gap.
There are three primary approaches to integrating ClickUp with Power BI:
Each method has trade-offs in terms of setup complexity, maintenance requirements, and flexibility. The choice depends on your organization’s technical expertise and reporting needs.
Before starting the integration, ensure you have:
Step 1: Select and Install a Connector
Choose a connector that aligns with your reporting requirements and IT policies. Vidi Corp is known for managed services, Asinaria for flexible DIY setups, and Skyvia for ETL capabilities.
Step 2: Authorize Access
Grant the connector access to your ClickUp workspace and provide credentials for your Power BI environment or destination database.
Step 3: Configure Data Extraction
Define which ClickUp spaces, folders, lists, and custom fields to sync. Most connectors allow you to filter and map fields to match your reporting needs.
Step 4: Schedule Data Refresh
Set up automatic refresh intervals (e.g., hourly, daily) to ensure your Power BI dashboards always reflect the latest project data.
Step 5: Import Data into Power BI
Use the connector’s integration with Power BI to load ClickUp data into your dashboards. Some connectors provide direct Power BI templates to accelerate setup.
Step 6: Build and Share Dashboards
Design custom dashboards in Power BI, visualizing key project metrics, task statuses, and milestones for client-facing reports.
Step 1: Generate ClickUp API Token
Navigate to your ClickUp profile settings, access the Apps section, and generate an API token.
Step 2: Configure Power BI “Get Data from Web”
In Power BI Desktop, use the “Get Data” > “Web” option to set up HTTP requests to ClickUp API endpoints (e.g., for tasks, lists, or custom fields).
Step 3: Authenticate and Transform Data
Include your API token in the request header. Use Power BI’s Power Query Editor to transform the JSON response into tabular data suitable for reporting.
Step 4: Schedule Refresh (Optional)
If using Power BI Service, configure scheduled refreshes to automate data updates.
ClickUp data is organized hierarchically:
For client reporting, model your data to highlight:
Leverage Power BI’s visualization capabilities to create:
Include interactive filters to allow clients to drill down by project, team member, or date range for a personalized reporting experience.
Automated connectors and Power BI Service support scheduled data refreshes, ensuring dashboards are always current. This is especially valuable for UAE-based service providers who need to deliver up-to-date information to clients without manual intervention.
A digital marketing agency in the UAE manages multiple client campaigns using ClickUp. Previously, account managers spent significant time manually exporting task lists and updating Excel-based reports for clients.
After implementing the Vidi Corp ClickUp–Power BI connector:
This approach is now standard for the agency’s client success team, supporting transparent, data-driven client relationships across the GCC.
For UAE organizations, these practices support compliance with local data protection regulations and ensure uninterrupted client reporting.
Power BI enables you to join ClickUp project data with CRM (e.g., Salesforce, HubSpot) or finance system data. This allows for:
Set up Power BI alerts to notify client success managers or clients when:
These proactive notifications help UAE-based teams maintain high service standards and client satisfaction.
Improve client trust with automated, visual project dashboards → Book a free 30-minute ClickUp–Power BI consultation.
No, there is currently no native integration between ClickUp and Power BI. Organizations must use third-party connectors or custom API setups to enable data sync and reporting automation.
You can sync spaces, folders, lists, tasks, custom fields, and other project-related data. The exact scope depends on the connector or API configuration you choose.
Refresh frequency depends on your integration method. Many third-party connectors and Power BI Service support scheduled automatic refreshes, ranging from hourly to daily updates.
Data security relies on proper API token management and the reliability of your chosen connector. Use reputable vendors, store credentials securely, and follow best practices for access control and credential rotation.
Yes, Power BI allows you to merge ClickUp data with CRM, finance, or other business systems. This enables comprehensive reporting and holistic client value analysis.
Popular options include Vidi Corp (managed services), Asinaria (DIY setup), and Skyvia (ETL pipelines). Choose a connector that aligns with your technical requirements and compliance needs.
Automation reduces manual effort, minimizes errors, delivers real-time insights, and enhances client transparency—key factors for service providers operating in the UAE and GCC.
Log in to ClickUp, go to your profile settings, select the Apps section, and generate or copy your API token. This token is required for both third-party connectors and custom API integrations.
Gantt charts, bar and pie charts, tables, and KPI cards are effective for visualizing project timelines, task statuses, and key performance metrics in client reports.
Use secure credential storage, restrict access to necessary data, and choose integration vendors with a strong track record in data security and compliance. Regularly review and update your data handling practices.
Yes, both third-party connectors and Power BI Service support scheduled refreshes. This ensures clients always see the latest project data without manual intervention.
Monitor data pipeline health, update scripts or connectors as APIs evolve, and periodically review access permissions. Managed services from vendors like Vidi Corp can offload much of this maintenance.
Some third-party connectors offer pre-built Power BI templates tailored for ClickUp project data. These templates can accelerate dashboard development and standardize client reporting.
UAE service providers gain a competitive edge by delivering transparent, automated client updates. This supports client retention, operational efficiency, and compliance with regional business standards.
Check connector logs, verify API credentials, and ensure your ClickUp workspace permissions are correctly configured. Consult your connector vendor’s support resources or technical documentation for troubleshooting guidance.
Yes, by modeling ClickUp data hierarchically (spaces, folders, lists), you can build Power BI dashboards that aggregate metrics across multiple clients, projects, or departments—ideal for agencies and consultancies serving diverse portfolios.
While there is significant user demand and ongoing feature requests, there is no official timeline for a native ClickUp–Power BI connector. Monitoring ClickUp’s product updates and community forums is recommended for the latest information.
Begin by evaluating third-party connectors like Vidi Corp, Asinaria, or Skyvia. Secure your API token, define your reporting requirements, and use available templates to accelerate dashboard creation.
Many connector vendors offer onboarding, managed services, and technical support. For complex deployments or compliance-sensitive environments, consider engaging a regional analytics consultancy with ClickUp and Power BI expertise.
Stay informed about ClickUp API updates by subscribing to their developer communications. Update your connectors or scripts as needed, and test integrations after major platform changes to ensure data continuity.
Yes, Power BI supports granular access controls. You can share dashboards with specific users or groups, ensuring clients only see data relevant to their projects.

Nhaif is an AI Automation Engineer & Business Analyst focused on ClickUp, AI, Automation, and Workflow Optimization. He helps businesses shift from scattered processes to streamlined, data-driven operations. With hands-on expertise, he simplifies complex tools into clear, easy-to-apply solutions.
Share it with friends!


.webp&w=3840&q=75)


share your thoughts