FSD-Motors

    Mastering Alerts and Threshold Profiles in Atera

    Anas Abdu Rauf
    September 28, 2025
    Atera alerts dashboard illustration showing cloud-based monitoring, proactive resolution, and device connections. Visualizes how IT teams in UAE, Dubai, GCC, and Africa can manage thresholds, tickets, and alerts for smarter incident response.

    Key Takeaways

    • Atera's alert system enables proactive device monitoring.
    • Threshold profiles allow customization of alert conditions.
    • Alerts can be viewed and managed across multiple interfaces.
    • Effective alert management enhances system reliability.
       

    Introduction

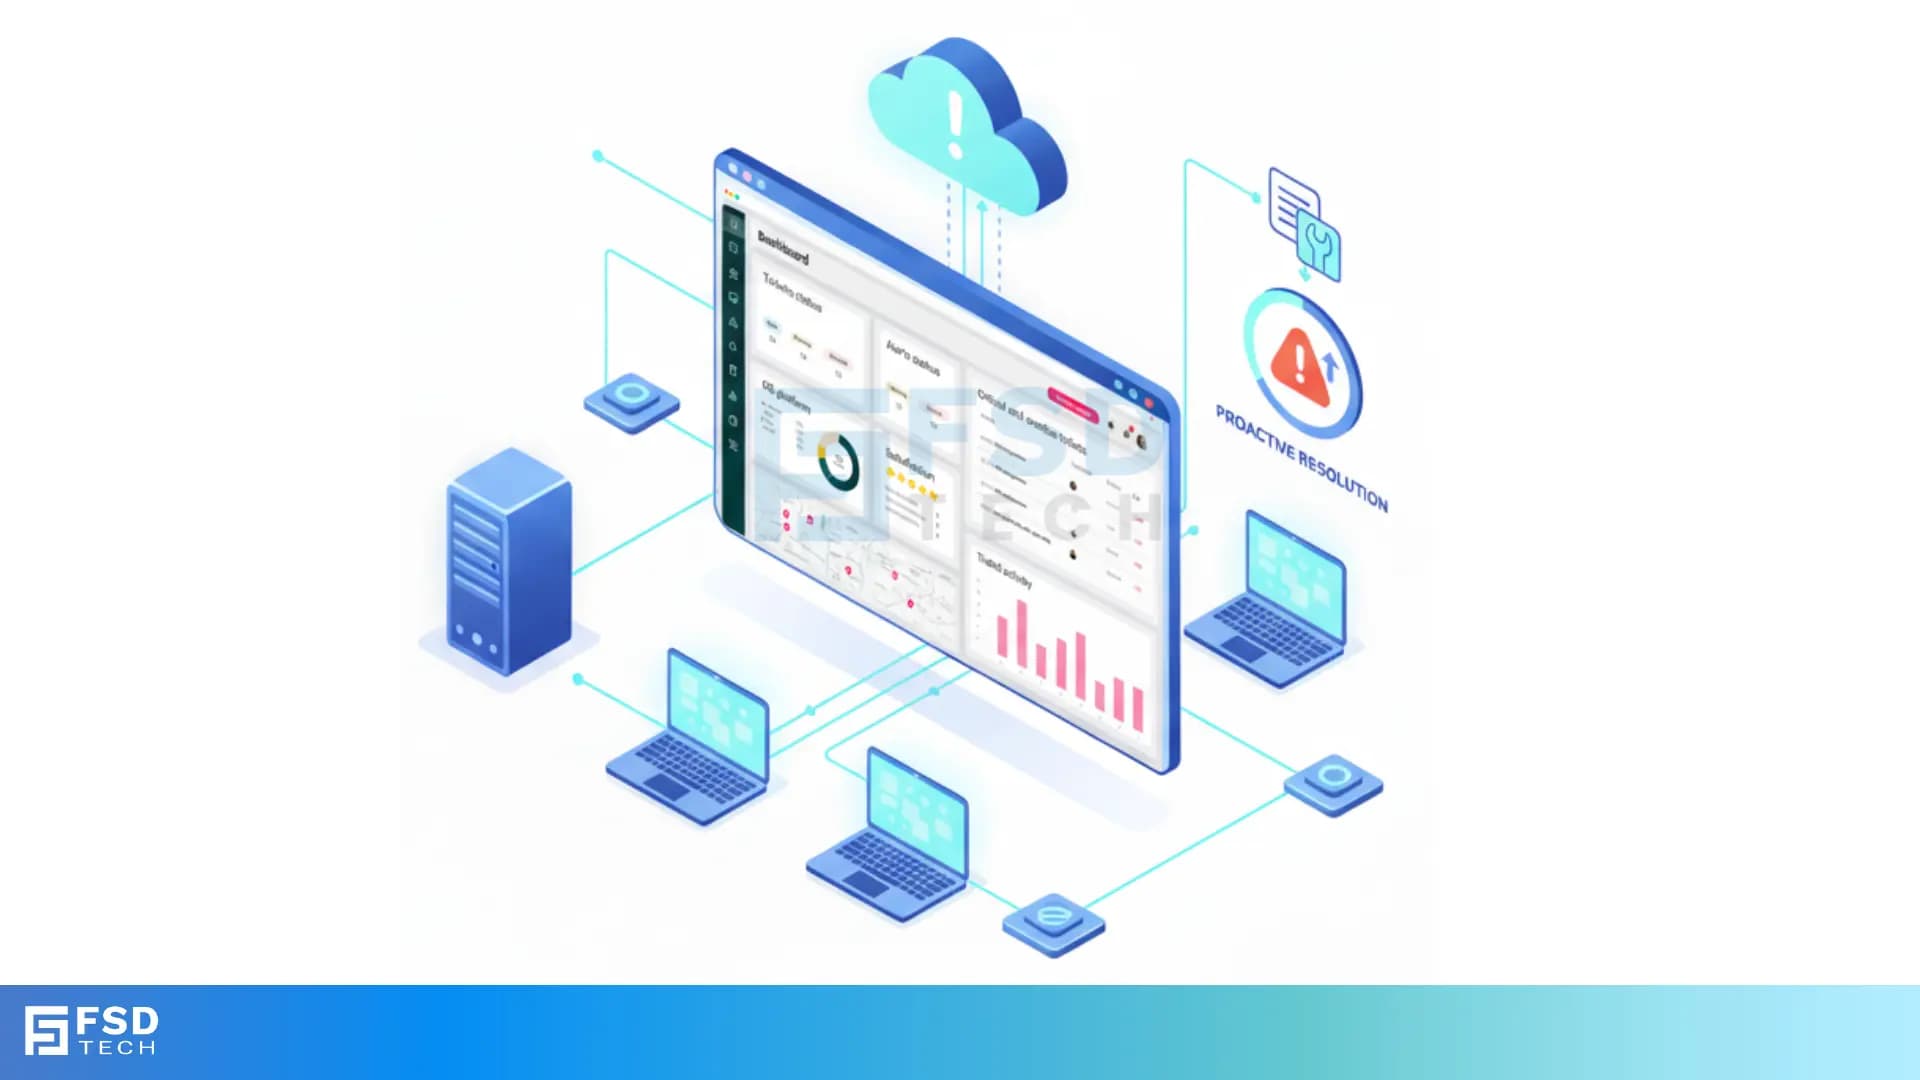
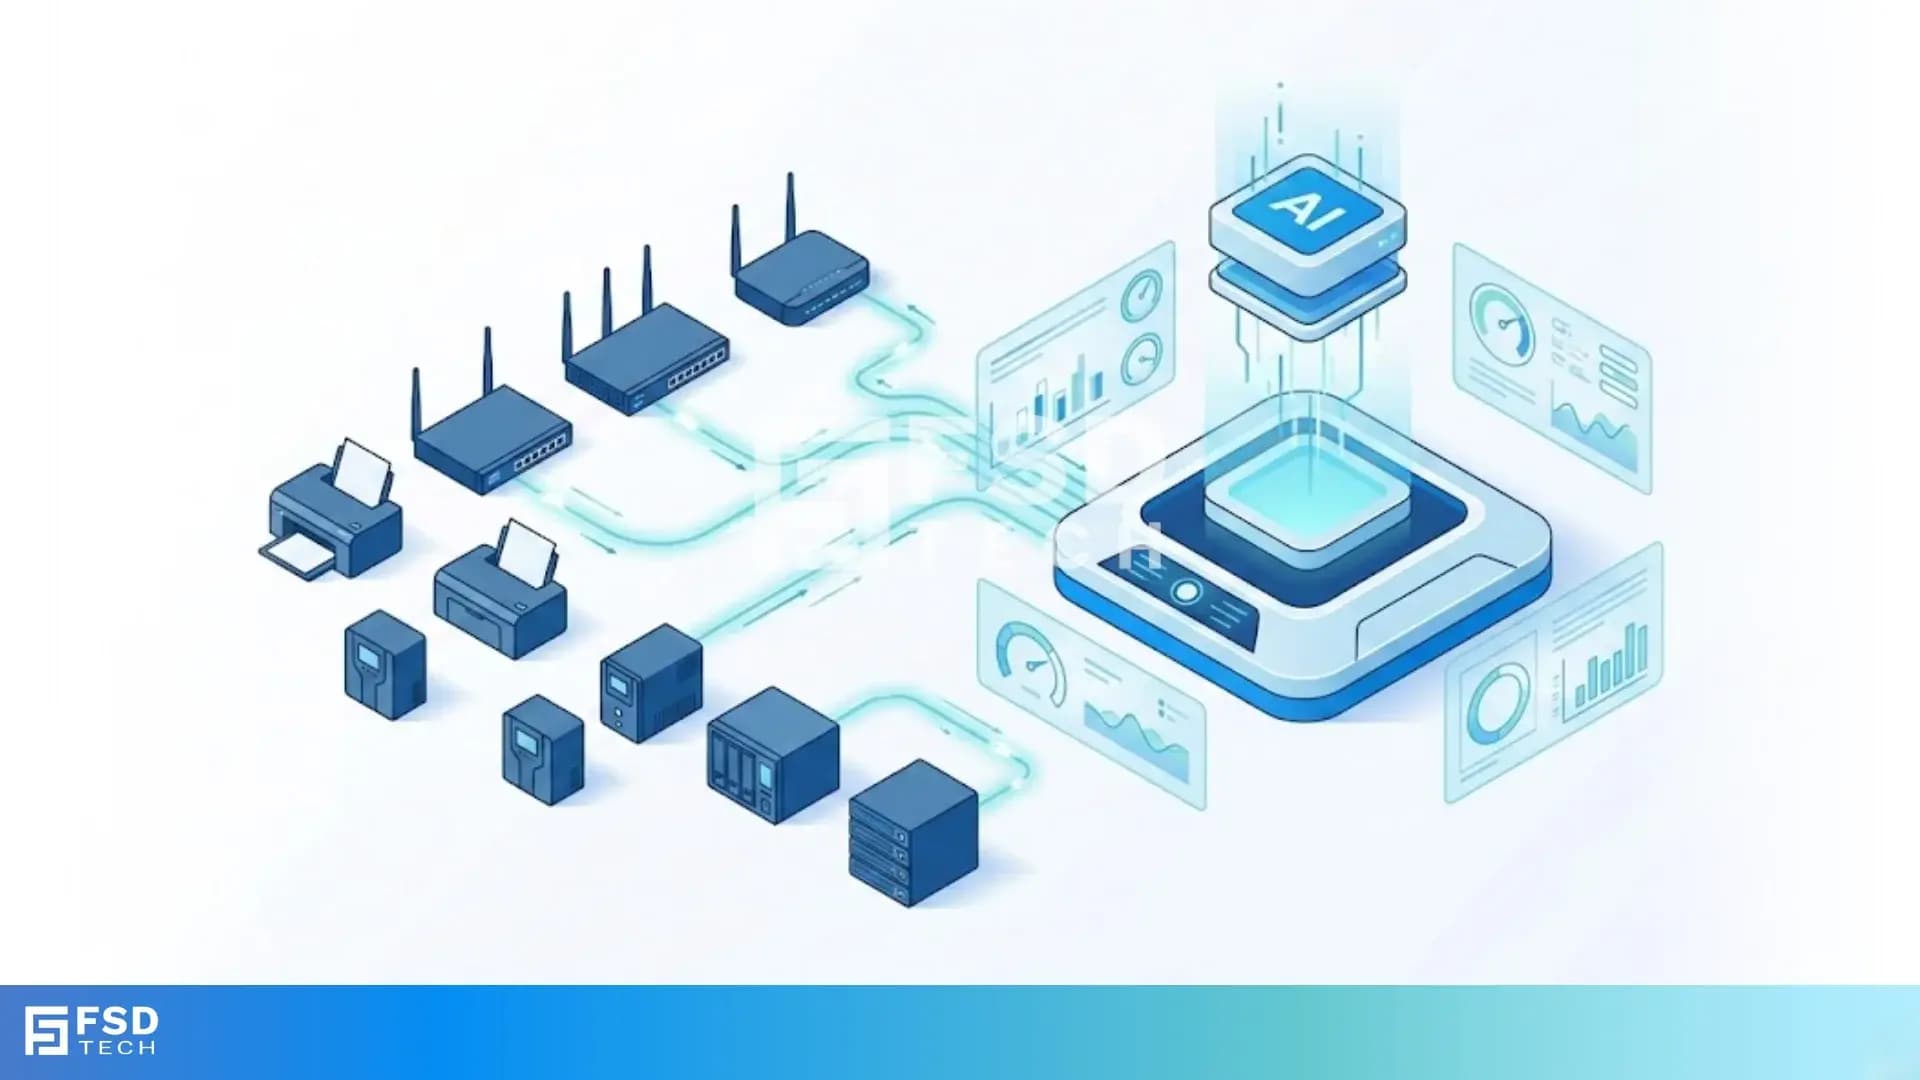
    In IT management, timely awareness of system issues is crucial. Atera's alerting system, combined with customizable threshold profiles, provides a robust framework for proactive monitoring and swift issue resolution.

    1. Understanding Atera's Alert System

    Atera generates alerts when monitored devices breach predefined thresholds, such as high CPU usage or low disk space. These alerts serve as early warnings, enabling IT professionals to address issues before they escalate.


    Atera IT monitoring dashboard showing ticket status, availability monitoring, recent critical alerts, unassigned tickets, and server alerts for proactive IT management in UAE, Dubai, GCC, and Africa.

    2. Creating and Assigning Threshold Profiles

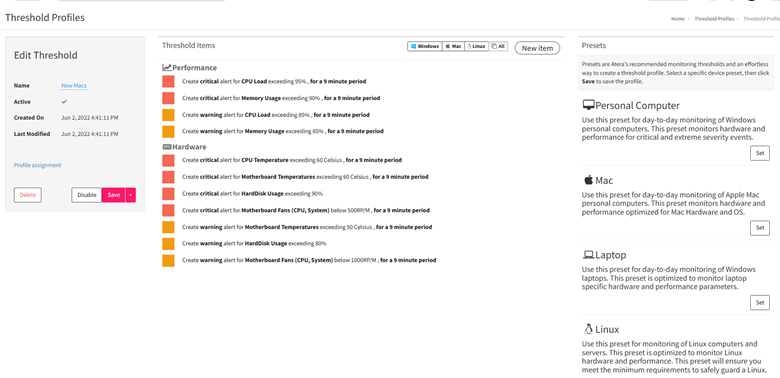
    Threshold profiles define the specific conditions under which alerts are triggered. These profiles can be customized to monitor various parameters and assigned to individual devices, customers, or folders, allowing tailored monitoring strategies. 
     

    Atera threshold profiles interface for IT monitoring — performance and hardware alerts setup for CPU, memory, temperature, and fan speed. Includes presets for Windows, Mac, Linux, and laptops, optimized for enterprises in UAE, Dubai, GCC, and Africa.

    3. Viewing and Managing Alerts

    Alerts can be accessed through multiple interfaces within Atera:

    • Dashboard: Provides a high-level overview of recent alerts across all devices. 
    • Agent Console: Offers device-specific alert details and management options. 
    • Alerts Page: Displays a comprehensive list of all alerts, with filtering options by site, severity, device type, and more. 

    These interfaces facilitate efficient monitoring and management of alerts, ensuring prompt responses to potential issues.

    Atera alerts page listing critical and warning alerts for devices — CPU load, disk usage, antivirus inactivity — with ticket creation and device management options. Designed for IT teams in UAE, Dubai, GCC, and Africa to manage incidents in real time.


    4. Best Practices for Alert Management

    • Customize Thresholds: Tailor threshold profiles to match the specific needs and risk levels of different devices or clients.
    • Regular Review: Periodically assess and adjust threshold settings to align with evolving system requirements.
    • Prioritize Alerts: Focus on high-severity alerts to address critical issues promptly.
    • Integrate with Ticketing: Convert alerts into tickets for structured tracking and resolution.

      Atera alert settings interface with email notifications, sound alerts, and automated ticket creation for critical and warning alerts. Enables IT admins in UAE, Dubai, GCC, and Africa to customize monitoring and streamline incident resolution.


    Final Thoughts

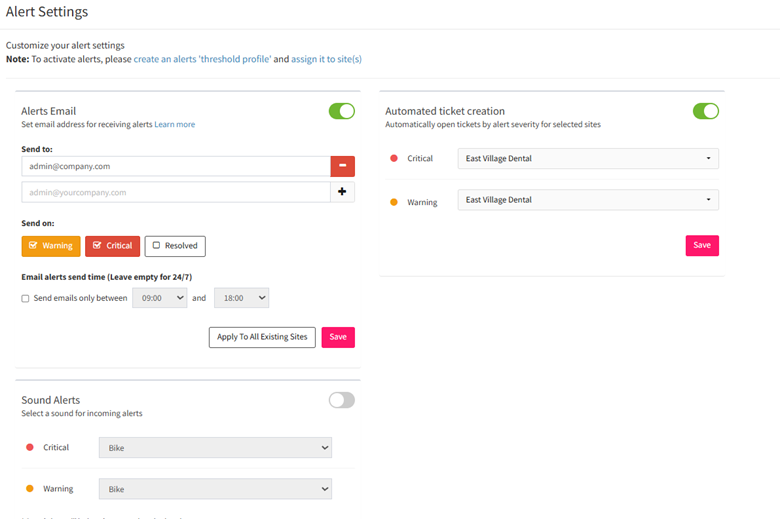
    Effective alert management is vital for maintaining system health and performance. By leveraging Atera's alerting capabilities and customizing threshold profiles, IT professionals can proactively address issues, minimize downtime, and ensure optimal system operations.


    Turn alerts into action with Atera. Schedule a free consultation with our experts today and discover how to build threshold profiles that prevent downtime, strengthen monitoring, and give your IT team more control

    Infographic on proactive IT monitoring with Atera alerts — explains why alerts matter, how to set threshold profiles, manage alerts via dashboards and consoles, and apply best practices for prioritizing high-severity incidents. Designed for IT teams in UAE, Dubai, GCC, and Africa


    FAQs

    1. What are threshold profiles in Atera?

    Threshold profiles in Atera define specific conditions (e.g., CPU usage, disk space) that, when met or exceeded, trigger alerts.


    2. How can I assign a threshold profile to a device?

    You can assign threshold profiles to individual devices, customers, or folders through the Atera interface. 


    3. Can I customize the alert conditions in a threshold profile?

    Yes, Atera allows you to customize the parameters and conditions within each threshold profile to suit your monitoring needs.


    4. Where can I view all the alerts generated by Atera?

    Alerts can be viewed on the Dashboard, Agent Console, and the dedicated Alerts Page, each offering different levels of detail and filtering options. 


    5. Is it possible to filter alerts by severity or device type?

    Yes, the Alerts Page provides filtering options by severity, device type, site, and more, enabling focused alert management.


    6. Can alerts be converted into tickets for issue tracking?

    Absolutely, Atera allows you to create tickets directly from alerts, facilitating structured issue tracking and resolution.

    Mastering Alerts and Threshold Profiles in Atera

    About The Author

    Anas Abdu Rauf

    Anas is an Expert in Network and Security Infrastructure, With over seven years of industry experience, holding certifications Including CCIE- Enterprise, PCNSE, Cato SASE Expert, and Atera Certified Master. Anas provides his valuable insights and expertise to readers.

    Like This Story?

    Share it with friends!

    Subscribe to our newsletter!

    share your thoughts