HomeNext Gen IT-InfraMonitoring & ManagementCyber SecurityBCP / DRAutomationDecoded
Next Gen IT-Infra
Cato’s SASE Supports Cybersecurity Skills Development

How Cato’s SASE Supports Cybersecurity Skills Development

🕓 April 8, 2025

How SASE Supports the Security Needs of SMBs

How SASE Supports the Security Needs of SMBs

🕓 February 9, 2025

Attack Surface Reduction with Cato’s SASE

Attack Surface Reduction with Cato’s SASE

🕓 February 10, 2025

SASE for Digital Transformation in UAE

SASE for Digital Transformation in UAE

🕓 February 8, 2025

Monitoring & Management
Understanding Atera’s SLA Management

Understanding Atera’s SLA Management

🕓 February 7, 2025

Cost-Performance Ratio: Finding the Right Balance in IT Management Networks

Cost-Performance Ratio: Finding the Right Balance in IT Management Networks

🕓 June 16, 2025

Customizing Atera with APIs

Customizing Atera with APIs

🕓 March 3, 2025

Power Up Your IT Team’s Strategy with Atera’s Communication Tools

Power Up Your IT Team’s Strategy with Atera’s Communication Tools

🕓 February 8, 2025

Cyber Security
Illustration of the Cato Cloud architecture showing its role in delivering SASE for secure, optimized global connectivity.

Understanding the Cato Cloud and Its Role in SASE

🕓 January 29, 2025

Isometric illustration of professionals managing network performance, bandwidth analytics, and cloud-based optimization around the Cato Networks platform, symbolizing bandwidth control and QoS visibility.

Mastering Bandwidth Control and QoS in Cato Networks

🕓 July 26, 2025

Global network backbone powering Cato SASE solution for secure, high-performance connectivity across regions.

Global Backbone: The Engine Powering Cato’s SASE Solution

🕓 January 30, 2025

Illustration of team analyzing application traffic and usage insights on a large laptop screen using Cato’s dashboard, surrounded by network and cloud icons.

Cato Networks Application Visibility | Monitoring & Control

🕓 July 27, 2025

BCP / DR
Illustration showing diverse business and IT professionals collaborating with cloud, backup, and security icons, representing Vembu use cases for SMBs, MSPs, and IT teams.

Who Uses Vembu? Real-World Use Cases for SMBs, MSPs & IT Teams

🕓 July 12, 2025

Graphic showcasing Vembu’s all-in-one backup and disaster recovery platform with icons for cloud, data protection, and business continuity for IT teams and SMBs.

What Is Vembu? A Deep Dive Into the All in One Backup & Disaster Recovery Platform

🕓 July 6, 2025

Illustration showing Vembu backup and disaster recovery system with cloud storage, server racks, analytics dashboard, and IT professionals managing data.

The Rising Cost of Data Loss: Why Backup Is No Longer Optional?

🕓 August 14, 2025

3D isometric illustration of cloud backup and data recovery infrastructure with laptop, data center stack, and digital business icons — FSD Tech

RPO & RTO: The Heart of Business Continuity

🕓 August 15, 2025

Automation
Cross-Functional Collaboration with ClickUp

Fostering Cross-Functional Collaboration with ClickUp for Multi-Departmental Projects

🕓 February 11, 2025

ClickUp Project Reporting

Revolutionizing Enterprise Reporting with ClickUp’s Advanced Analytics and Dashboards

🕓 June 16, 2025

ClickUp’s Design Collaboration and Asset Management Tools

Empowering Creative Teams with ClickUp’s Design Collaboration and Asset Management Tools

🕓 February 26, 2025

ClickUp Communication and Collaboration Tools

ClickUp Communication and Collaboration Tools: Empowering Remote Teams

🕓 March 12, 2025

Decoded
Multi-Factor Authentication (MFA)

Multi-Factor Authentication (MFA): All You Need to Know

🕓 December 7, 2025

L3 Switch

What Is an L3 Switch? L2 vs L3 & Why You Need Layer 3?

🕓 December 8, 2025

IPSec

IPSec Explained: Protocols, Modes, IKE & VPN Security

🕓 December 3, 2025

 Datagram Transport Layer Security (DTLS)

What is Datagram Transport Layer Security (DTLS)? How it works?

🕓 December 4, 2025

    Subscribe to our newsletter!

    About Us

    Follow Us

    Copyright © 2024 | Powered by 

    Atera

    (55)

    Cato Networks

    (121)

    ClickUp

    (78)

    FishOS

    (7)

    Miradore

    (21)

    PointGuard AI

    (9)

    Vembu

    (22)

    Xcitium

    (33)

    ZETA HRMS

    (79)

    Table of Contents

    Step-by-Step: Setting Up Proactive Alerts with Smart Thresholds

    Anas Abdu Rauf
    August 20, 2025
    Comments
    FSD Tech illustration showing Atera smart alerts, automation robot, IT team collaboration, and warning signals.

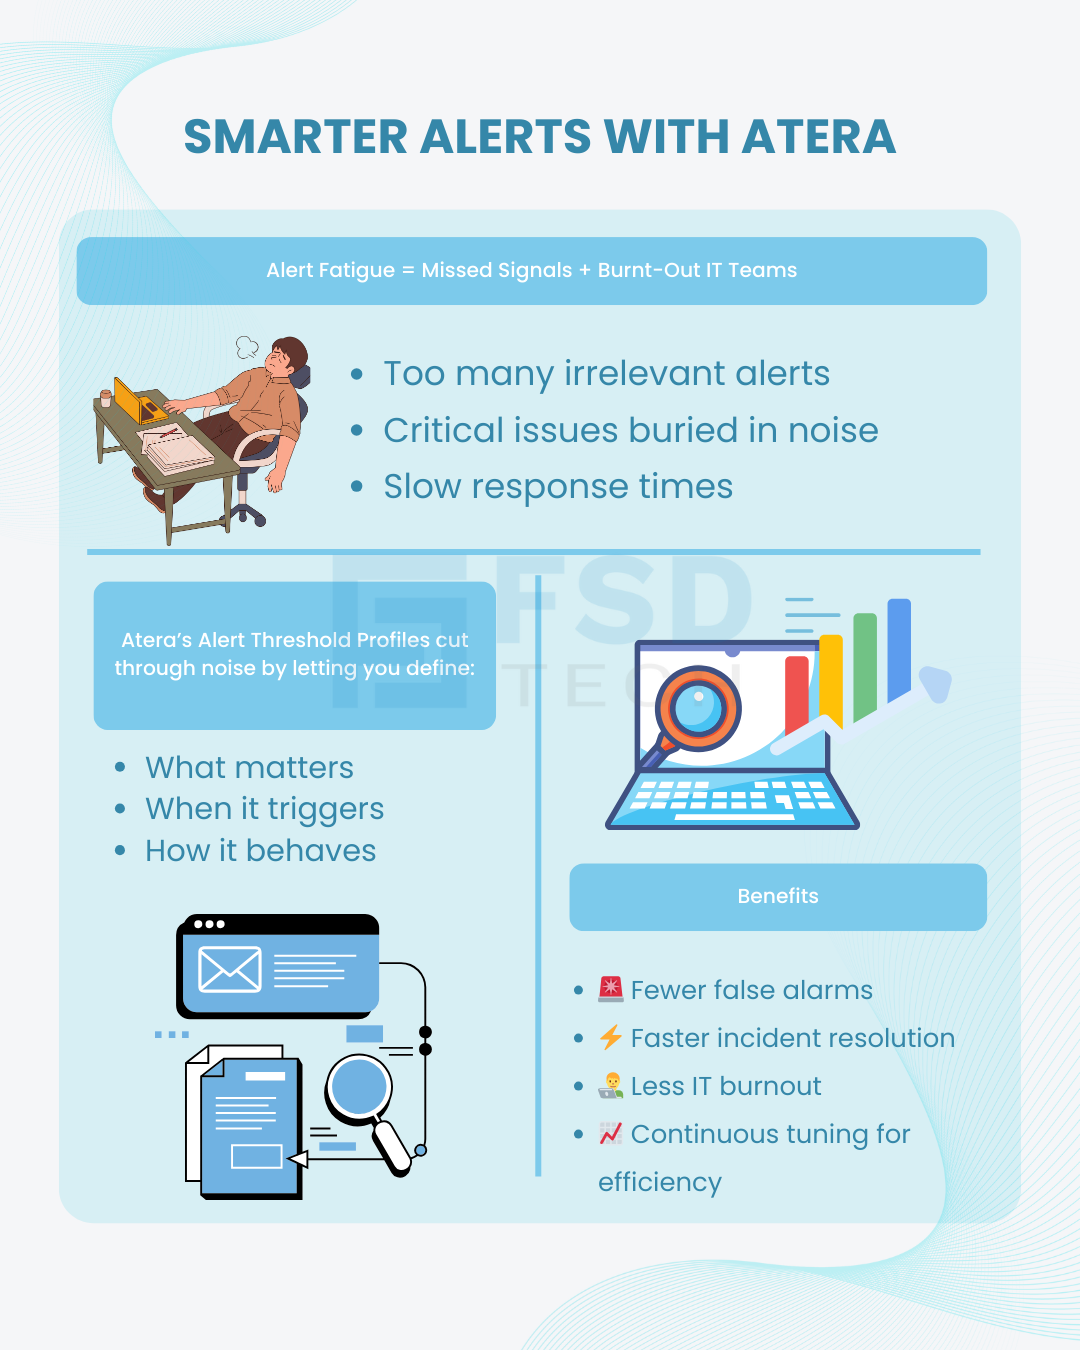
    Alert fatigue is real—and damaging. IT teams either drown in irrelevant notifications or miss critical signals entirely. Atera’s Alert Threshold Profiles offer a smarter way: define exactly what matters, when it should trigger an alert, and how it should behave once triggered.
     

    This blog walks you through creating a smart threshold profile, customizing it, assigning it across environments, and validating that it works in real-world conditions—so you can turn down the noise and amplify the signals that matter most.


    Key Takeaways

    • Create new alert threshold profiles under Admin > Thresholds
    • Customize CPU, memory, disk, process, and service conditions
    • Assign the profile to customers, sites, or specific devices
    • Validate trigger behavior with manual tests on pilot endpoints
    • Refine thresholds using Atera’s live Alerts dashboard
       

    Get started with smarter alerts today — share your details and we’ll help you customize your first profile. Click Here
     

    1. Create Your First Alert Threshold Profile

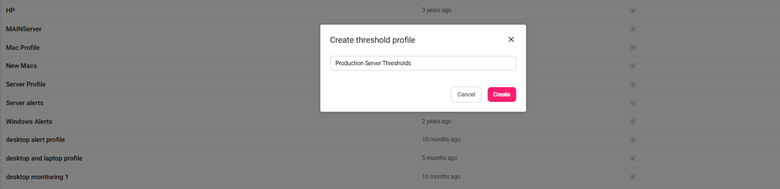
    What it does: Lets you define a dedicated set of alert rules grouped under one profile.

    Where it lives: Admin > Monitoring and automation > Thresholds

    Why you’ll love it: It provides a clean, reusable way to build monitoring rules for different customer tiers, environments, or device roles.

    1. Go to Admin > Thresholds
    2. Click Add Profile
    3. Name the profile (e.g., "Prod-Server Thresholds") and save

    Now the profile is listed and ready for customization.


    Atera interface for creating a new production server threshold profile.


    2. Customize Smart Threshold Items

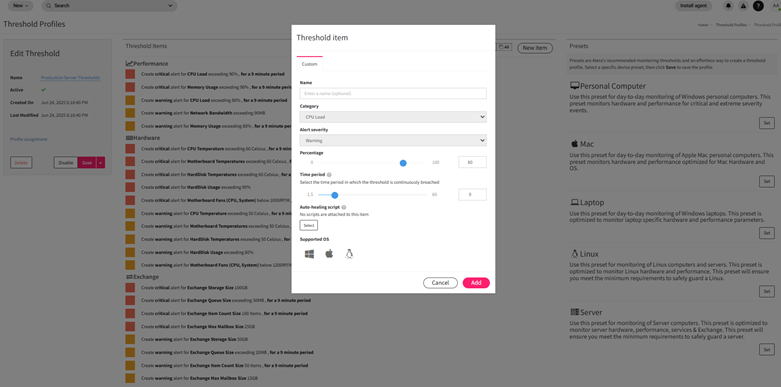
    What it does: Allows granular control over what conditions generate alerts and at what severity.

    Where it lives: Inside the Threshold Profile editor

    Why you’ll love it: You can define exact CPU, RAM, disk usage, and process rules per environment or use case.

    • Expand Performance and input values for Warning and Critical thresholds
    • Configure Hardware values for disks, fans, and temperatures
    • Add rules under Process Monitoring and Event IDs as needed
    • Tweak thresholds for Exchange services or antivirus status if relevant
       

    Customizing alert threshold items in Atera with CPU usage settings and performance monitoring options.

    3. Assign the Profile to Devices, Customers, or Sites

    What it does: Ensures your threshold profile actively monitors the right endpoints.

    Where it lives: Threshold Profiles > Profile Assignment button

    Why you’ll love it: One-click assignment lets you scale the same rules across hundreds of endpoints.

    1. From the Threshold Profiles list, click Assign
    2. Choose whether to assign to Devices, Sites, or Customers
    3. Select targets and apply


    Atera dashboard showing threshold profile assignment to customer sites for smarter IT alert management


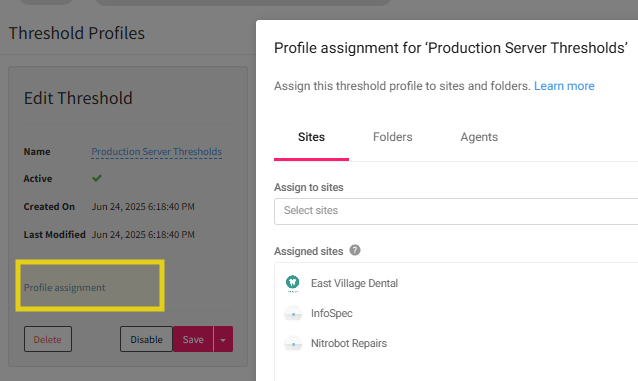
    Assigning by customer is ideal for MSPs managing distinct SLA tiers.


    4. Test and Validate Alert Behavior

    What it does: Confirms that alerts trigger as expected and lead to the right actions.

    Where it lives: Alerts > Agent Console > Device view

    Why you’ll love it: You can catch false positives or missing triggers before rolling out company-wide.

    1. Pick a test device and open the Agent Console
    2. Use a CPU stress tool or disk fill script to simulate a breach
    3. Watch for alert appearance, notification delivery, and ticket generation

    You can also test whether automation rules or auto-ticketing triggers correctly from the alert.


    5. Monitor and Refine from the Alerts Page

    What it does: Lets you track live alerts and make data-backed refinements to your threshold rules.

    Where it lives: Alerts page

    Why you’ll love it: You’ll eliminate noise, detect blind spots, and continuously tune alert sensitivity.

    • Use filters to drill into alerts by profile, device, or severity
    • Resolve false alerts and trace back to adjust profile thresholds
    • Mark alerts as snoozed for temporary maintenance periods

    Refinement is ongoing—revisit your profiles monthly to adjust for seasonal or infrastructure changes.


    Ready to Tune Your Environment with Precision Alerts?

    Head to your Thresholds tab and create your first custom profile. Assign it to a small test group, validate alert behavior, then scale it with confidence. Smarter alerts mean faster resolution times, reduced fatigue, and tighter IT operations.


    Book a quick session with our experts to validate your alert setup and avoid missed signals. Schedule Now
     

    Infographic explaining Atera’s smarter alerts: fewer false alarms, faster resolution, less IT burnout, and continuous tuning.


    FAQ

    1. Can I use multiple threshold profiles on a single device in Atera?

    No. Only one threshold profile can be assigned per device at a time. If multiple profiles apply, the most recently assigned one will override any previous assignment.


    2. What severity levels can I configure in Atera alerts?

    Atera supports three severity levels:

    • Information
    • Warning
    • Critical
      You can assign severity when defining thresholds for CPU, RAM, disk, processes, or services.


    3. How do I automatically create a ticket when a threshold is breached in Atera?

    To auto-create tickets from alerts:

    • Enable Auto-Ticketing during Threshold Profile setup
    • Ensure your automation rules are active under Admin > Ticket Automation
      This ensures every alert can generate a ticket without manual intervention.


    4. How can I control who receives Atera alert notifications?

    Go to Admin > Contacts & Notifications.
    Here you can:

    • Add or remove recipients for alert emails
    • Choose who gets notified per alert type or severity
    • Customize notification behavior for individual customers or devices


    5. Can I pause alerts during scheduled maintenance in Atera?

    Yes. Use the Snooze function to pause alerts temporarily, or configure scheduled maintenance windows from the Alerts page, which suppresses alerts for selected timeframes.


    6. How do I test if a threshold profile is working correctly?

    1. Assign the profile to a test device
    2. Use tools to simulate stress (e.g., high CPU load or disk fill)
    3. Watch the Alerts page or Agent Console for proper alert generation
      This lets you catch false positives or confirm expected behavior before full deployment.


    7. Can I assign a threshold profile to multiple devices or customers at once?

    Yes. Go to Threshold Profiles > Assign, then:

    • Select Devices, Sites, or Customers
    • Apply the profile in bulk with one click
      Ideal for MSPs managing multiple environments.


    8. How do I fine-tune thresholds after deployment?

    Use the Alerts dashboard to:

    • Filter alerts by severity, device, or profile
    • Identify false positives
    • Adjust your profile’s threshold settings accordingly
      Refine monthly to align with seasonal loads or infrastructure changes.


    Step-by-Step: Setting Up Proactive Alerts with Smart Thresholds

    About The Author

    Anas Abdu Rauf

    Anas is an Expert in Network and Security Infrastructure, With over seven years of industry experience, holding certifications Including CCIE- Enterprise, PCNSE, Cato SASE Expert, and Atera Certified Master. Anas provides his valuable insights and expertise to readers.

    TRY OUR PRODUCTS

    Like This Story?

    Share it with friends!

    Subscribe to our newsletter!

    FishOSCato SASEVembuXcitiumZeta HRMSAtera
    Isometric illustration of a centralized performance platform connected to analytics dashboards and team members, representing goal alignment, measurable outcomes, risk visibility, and strategic project tracking within ClickUp.

    How ClickUp Enables Outcome-Based Project Management (Not Just Task Tracking)

    🕓 February 15, 2026

    Isometric illustration of a centralized executive dashboard platform connected to analytics panels, performance charts, security indicators, and strategic milestones, representing real-time business visibility and decision control within ClickUp.

    Executive Visibility in ClickUp – How CXOs Gain Real-Time Control Without Micromanaging

    🕓 February 13, 2026

    Cato SASE Architecture

    Inside Cato’s SASE Architecture: A Blueprint for Modern Security

    🕓 January 26, 2025

    Workflow Automation(8)

    Workforce Automation(1)

    AI Project Management(1)

    HR Data Automation(1)

    RMM(1)

    IT Workflow Automation(1)

    GCC compliance(4)

    IT security(2)

    Payroll Integration(2)

    IT support automation(3)

    procurement automation(1)

    lost device management(1)

    IT Management(5)

    IoT Security(2)

    Cato XOps(2)

    IT compliance(4)

    Task Automation(1)

    Workflow Management(1)

    Kubernetes lifecycle management(2)

    OpenStack automation(1)

    AI-powered cloud ops(1)

    SMB Security(8)

    Data Security(1)

    MDR (Managed Detection & Response)(4)

    MSP Automation(3)

    Atera Integrations(2)

    XDR Security(2)

    Ransomware Defense(3)

    SMB Cyber Protection(1)

    HR Tech Solutions(1)

    Zero Trust Network Access(3)

    Zero Trust Security(2)

    Endpoint Management(1)

    SaaS Security(1)

    Payroll Automation(5)

    IT Monitoring(2)

    Xcitium EDR SOC(15)

    Ransomware Protection GCC(1)

    Network Consolidation UAE(1)

    M&A IT Integration(1)

    MSSP for SMBs(1)

    FSD-Tech MSSP(25)

    Managed EDR FSD-Tech(1)

    SMB Cybersecurity GCC(1)

    Ransomware Protection(3)

    Antivirus vs EDR(1)

    Endpoint Security(1)

    Cybersecurity GCC(12)

    Data Breach Costs(1)

    Endpoint Protection(1)

    Xcitium EDR(30)

    Managed Security Services(2)

    SMB Cybersecurity(8)

    Zero Dwell Containment(31)

    Cloud Backup(1)

    Hybrid Backup(1)

    Backup & Recovery(1)

    pointguard ai(4)

    SMB data protection(9)

    backup myths(1)

    disaster recovery myths(1)

    vembu(9)

    Disaster Recovery(4)

    Vembu BDR Suite(19)

    DataProtection(1)

    GCCBusiness(1)

    GCC IT Solutions(1)

    Secure Access Service Edge(4)

    Unified Network Management(1)

    GCC HR software(20)

    CC compliance(1)

    open banking(1)

    financial cybersecurity(2)

    Miradore EMM(15)

    Government Security(1)

    Cato SASE(8)

    Hybrid Learning(1)

    Cloud Security(9)

    GCC Education(1)

    Talent Development(1)

    AI Risk Management(1)

    AI Compliance(2)

    AI Cybersecurity(12)

    AI Governance(4)

    AI Security(2)

    Secure Remote Access(1)

    GCC business security(1)

    GCC network integration(1)

    compliance automation(5)

    GCC cybersecurity(3)

    education security(1)

    BYOD security Dubai(8)

    Miradore EMM Premium+(5)

    App management UAE(1)

    MiddleEast(1)

    HealthcareSecurity(1)

    Team Collaboration(1)

    IT automation(12)

    Zscaler(1)

    SD-WAN(7)

    share your thoughts

    Isometric illustration showing a centralized IT monitoring and automation platform connecting cloud services, servers, laptops, and dashboards, representing thresholds, alerts, secure data flow, and automated remediation across distributed systems.

    Thresholds, Alerts & Auto-Healing in Atera (and where AI Copilot helps)

    🕓 February 11, 2026

    Isometric illustration showing Atera AI Copilot integrated with automation profiles and patch management workflows, depicting governed scripting, secure execution paths, approval checkpoints, and centralized control across IT systems.

    Integrating AI Copilot with Automation Profiles & Patch Management in Atera

    🕓 February 9, 2026

    Isometric illustration of Account Intelligence as a central platform connecting laptops, servers, and network devices, representing real-time device visibility, lifecycle management, discovery of unmanaged assets, and synchronized inventory across IT environments.

    Account Intelligence in Atera: Offline Devices, Trends & Discovery

    🕓 February 8, 2026

    Decoded(123)

    Cyber Security(118)

    BCP / DR(22)

    Zeta HRMS(78)

    SASE(21)

    Automation(78)

    Next Gen IT-Infra(118)

    Monitoring & Management(76)

    ITSM(22)

    HRMS(21)

    Automation(24)