.webp&w=3840&q=75)
How ClickUp Enables Outcome-Based Project Management (Not Just Task Tracking)
🕓 February 15, 2026
Infrastructure monitoring acts as the central nervous system for your company’s digital health and performance. Imagine trying to drive a car through a thick fog without a dashboard; you wouldn't know your speed, fuel level, or if the engine is overheating until it's too late. In the tech world, this "dashboard" is what keeps your servers, networks, and applications running smoothly.
Have you ever wondered why some websites never seem to crash, even during massive sales? It isn't just luck. These companies use infrastructure monitoring to see problems before they impact a single customer. To be honest, we've all been there—staring at a loading screen that feels like it’s taking forever. As a developer or business owner, that's the last thing you want for your users.
In this guide, we'll walk through how this technology works and why your business needs it to survive. We're going to keep things simple and skip the heavy jargon. Ready to see how you can keep your systems in peak condition?
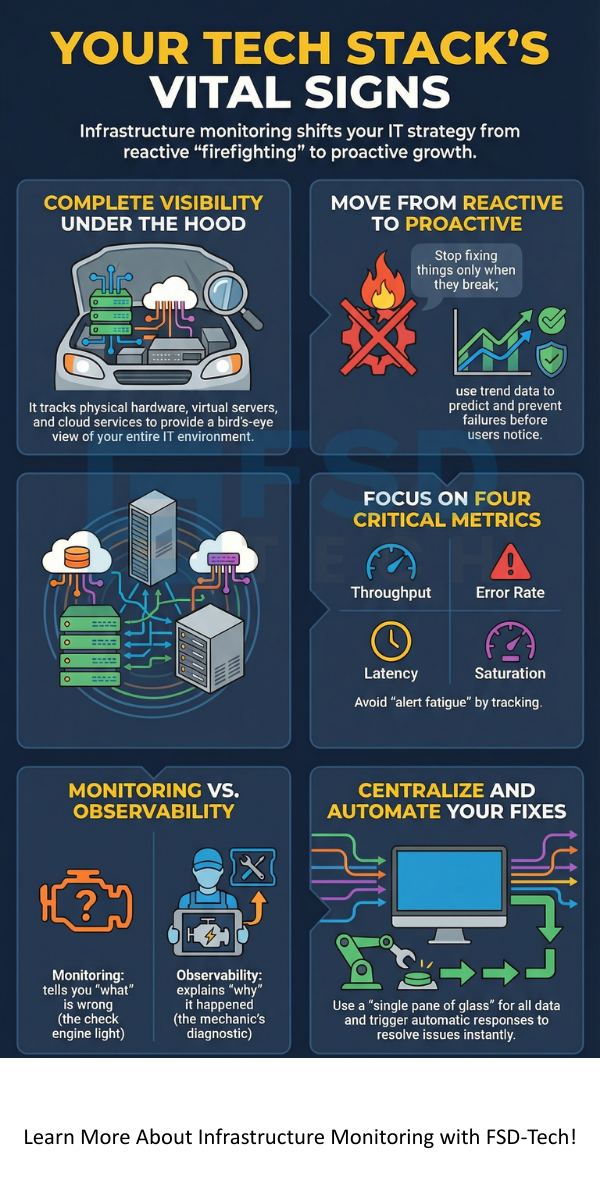
At its core, infrastructure monitoring is the process of collecting and analyzing data from your entire IT environment. This includes your physical hardware, virtual servers, software, and even your cloud services. It gives you a bird’s-eye view of everything happening "under the hood."
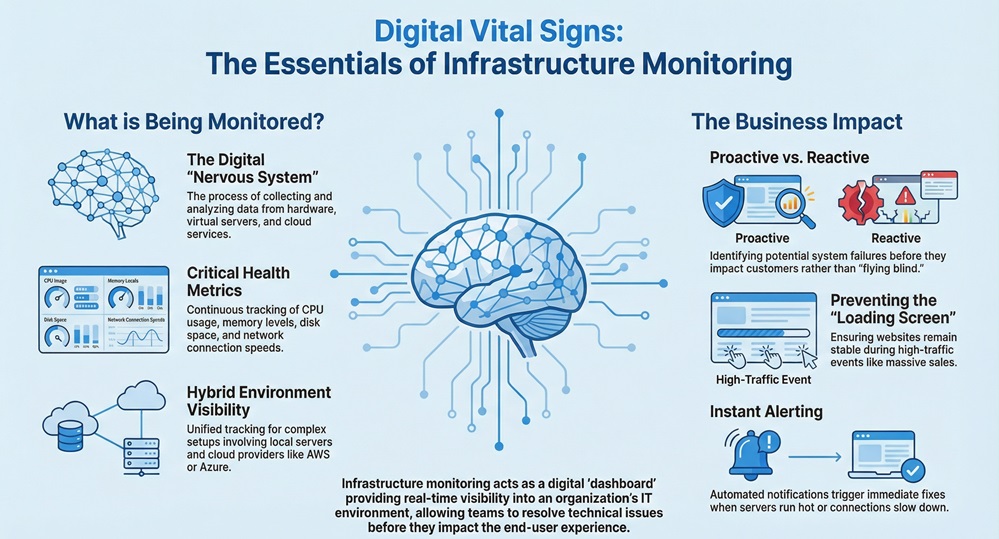
Think of it as a constant health check. The system looks at metrics like CPU usage, memory levels, and disk space. If a server starts to run too hot or a network connection slows down, the monitoring tool sends an alert. This allows your team to fix the issue right away.
Why does this matter?
Well, modern IT setups are complex. We use a mix of local servers and cloud providers like AWS or Azure. Without a clear way to track these moving parts, you're essentially flying blind.
You might ask, "How does a piece of software know what's happening across a hundred different servers?" It usually happens in one of two ways: agents or agentless polling.
The Role of Agents
An agent is a small piece of software you install on a device. It lives there and "whispers" data back to a central server. It can see deep details that are hard to get from the outside.
Agentless Monitoring
This method uses standard protocols (like SNMP or SSH) to "ask" the device how it's doing. It's like a doctor calling you on the phone to ask about your symptoms instead of visiting you in person. Both methods work, but they serve different needs depending on your security and setup.
Here's the thing: downtime is expensive. Every minute your site is down, you lose money and trust. Infrastructure monitoring helps you move from being "reactive" to "proactive."
In my experience, teams that don't monitor spend all day "firefighting." They only fix things when they break. With the right tools, you can spend that time building new features instead.
Also Read: What is Throughput? Definition, OS & Networking
When we talk about your "stack," we mean all the layers that make your business run. Infrastructure monitoring needs to cover all of them to be effective.
Server Monitoring
This is the most basic level. You check if the physical or virtual machines are alive. Are they running out of RAM? Is the processor working too hard?
Network Monitoring
This tracks the flow of data between your servers and the outside world. If the "pipes" are clogged, it doesn't matter how fast your server is; the data won't get through.
Storage Monitoring
Data is the lifeblood of your company. You need to know if your disks are getting full or if the data transfer speed is dropping.
Cloud Infrastructure
If you use AWS, Splunk, or NetApp, you're likely dealing with "virtual" infrastructure. Monitoring here is vital because you're paying for what you use. If you don't watch it, your bill can skyrocket.
People often use these words as if they mean the same thing, but they don't. Infrastructure monitoring tells you what is wrong (e.g., "The server is down"). Observability helps you understand why it happened by looking at the internal state of the system through logs and traces.
Think of it this way: Monitoring is the "Check Engine" light in your car. Observability is the mechanic's computer that tells them exactly which sensor is misfiring. You need both to have a truly resilient system.
Also Read: What is Latency in Networking? Definition, Causes & Solutions
Not all data is useful. If you track everything, you'll get "alert fatigue" and start ignoring the notifications. To make infrastructure monitoring work, focus on these:
If your saturation hits 90%, you know you're in trouble soon. It's like seeing a line at a grocery store get longer and longer; eventually, you need to open another register.
To be honest, setting up a tool is the easy part. Making it useful is where the real work happens. Here is how we recommend doing it:
Set Meaningful Thresholds
Don't set an alert for 50% CPU usage if your server normally runs at 70%. You'll just get annoyed. Set alerts for when things are actually critical.
Centralize Your Data
Don't use five different tools for five different servers. Try to get everything into one "single pane of glass." This makes it much easier to see how one problem affects another.
Automate the Fix
The best infrastructure monitoring doesn't just tell you there's a problem; it triggers a fix. For example, if a server gets too full, the system can automatically spin up a new one.
Many companies are moving away from local tools to cloud-based solutions like Splunk or AWS CloudWatch. Why? Because these tools scale with you. If you add 1,000 new users tomorrow, a cloud-based infrastructure monitoring tool won't blink. It also means you don't have to maintain the monitoring server itself!
Nothing is perfect. When you start with infrastructure monitoring, you might run into a few bumps:
At the end of the day, infrastructure monitoring isn't just a technical "nice-to-have." it's a fundamental part of running a modern business. We believe that clarity leads to better decisions. When you can see your entire tech stack clearly, you can stop worrying about crashes and start focusing on growth.
At FSD-Tech, we're dedicated to helping you gain that clarity. We value our clients' peace of mind above all else. Our goal is to provide the insights you need to keep your digital world spinning without a hitch.
Ready to stop guessing and start knowing?
The main goal is to ensure all IT components work as they should. It helps maintain "uptime" and ensures a smooth experience for users.
Yes! Most modern tools are "hybrid." They can see your physical servers in the office and your virtual servers in the cloud at the same time.
No. APM (Application Performance Monitoring) looks at the code inside the app. Infrastructure monitoring looks at the "house" the app lives in (the servers and networks).
If done right, the impact is tiny (usually less than 1% of CPU). The benefits of knowing your system is healthy far outweigh this small cost.

Surbhi Suhane is an experienced digital marketing and content specialist with deep expertise in Getting Things Done (GTD) methodology and process automation. Adept at optimizing workflows and leveraging automation tools to enhance productivity and deliver impactful results in content creation and SEO optimization.
Share it with friends!


.webp&w=3840&q=75)


share your thoughts