.webp&w=3840&q=75)
How ClickUp Enables Outcome-Based Project Management (Not Just Task Tracking)
🕓 February 15, 2026
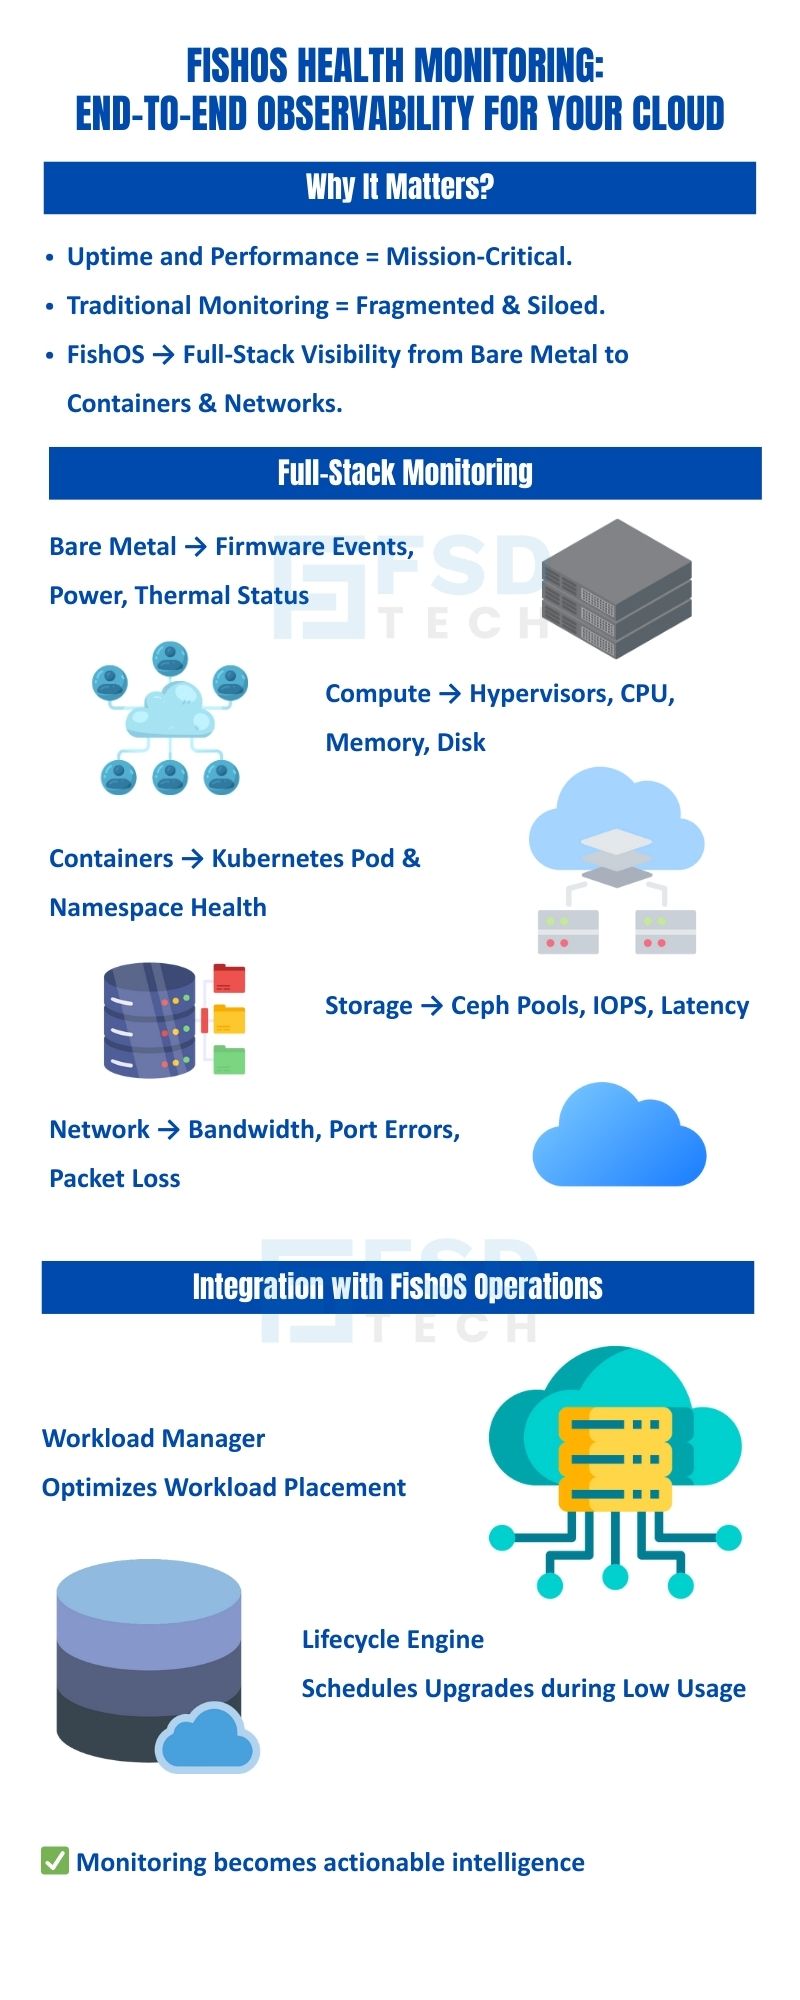
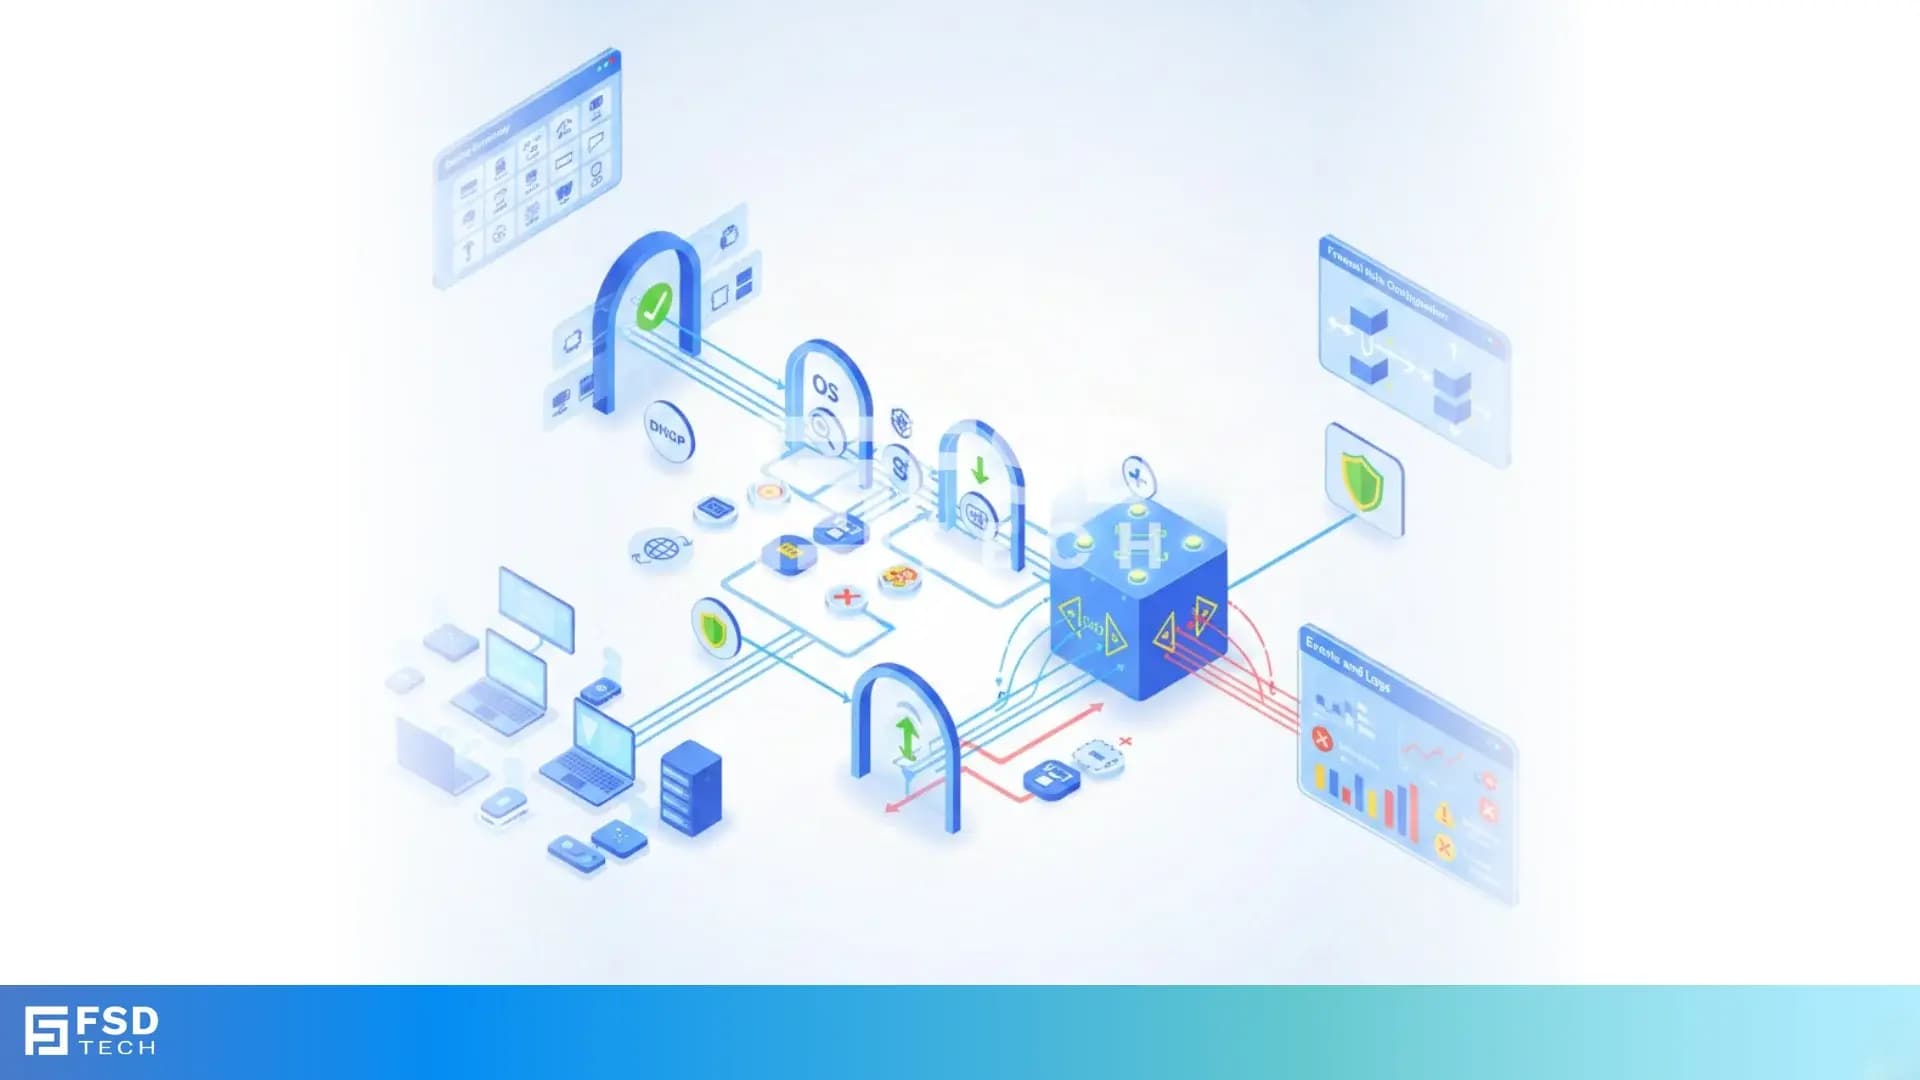
In enterprise cloud operations, maintaining uptime and performance is critical. FishOS Health Monitoring Service delivers a comprehensive observability layer that ensures full visibility across your infrastructure. The service monitors everything from bare metal servers to virtual machines, containers, storage systems, and networking, allowing teams to detect and address issues efficiently.
This solution integrates the FishOS Health Engine with advanced open-source components, providing centralized telemetry, visual dashboards, and insights directly within the FishOS platform. With this approach, organizations can reduce operational complexity and maintain continuous cloud performance.
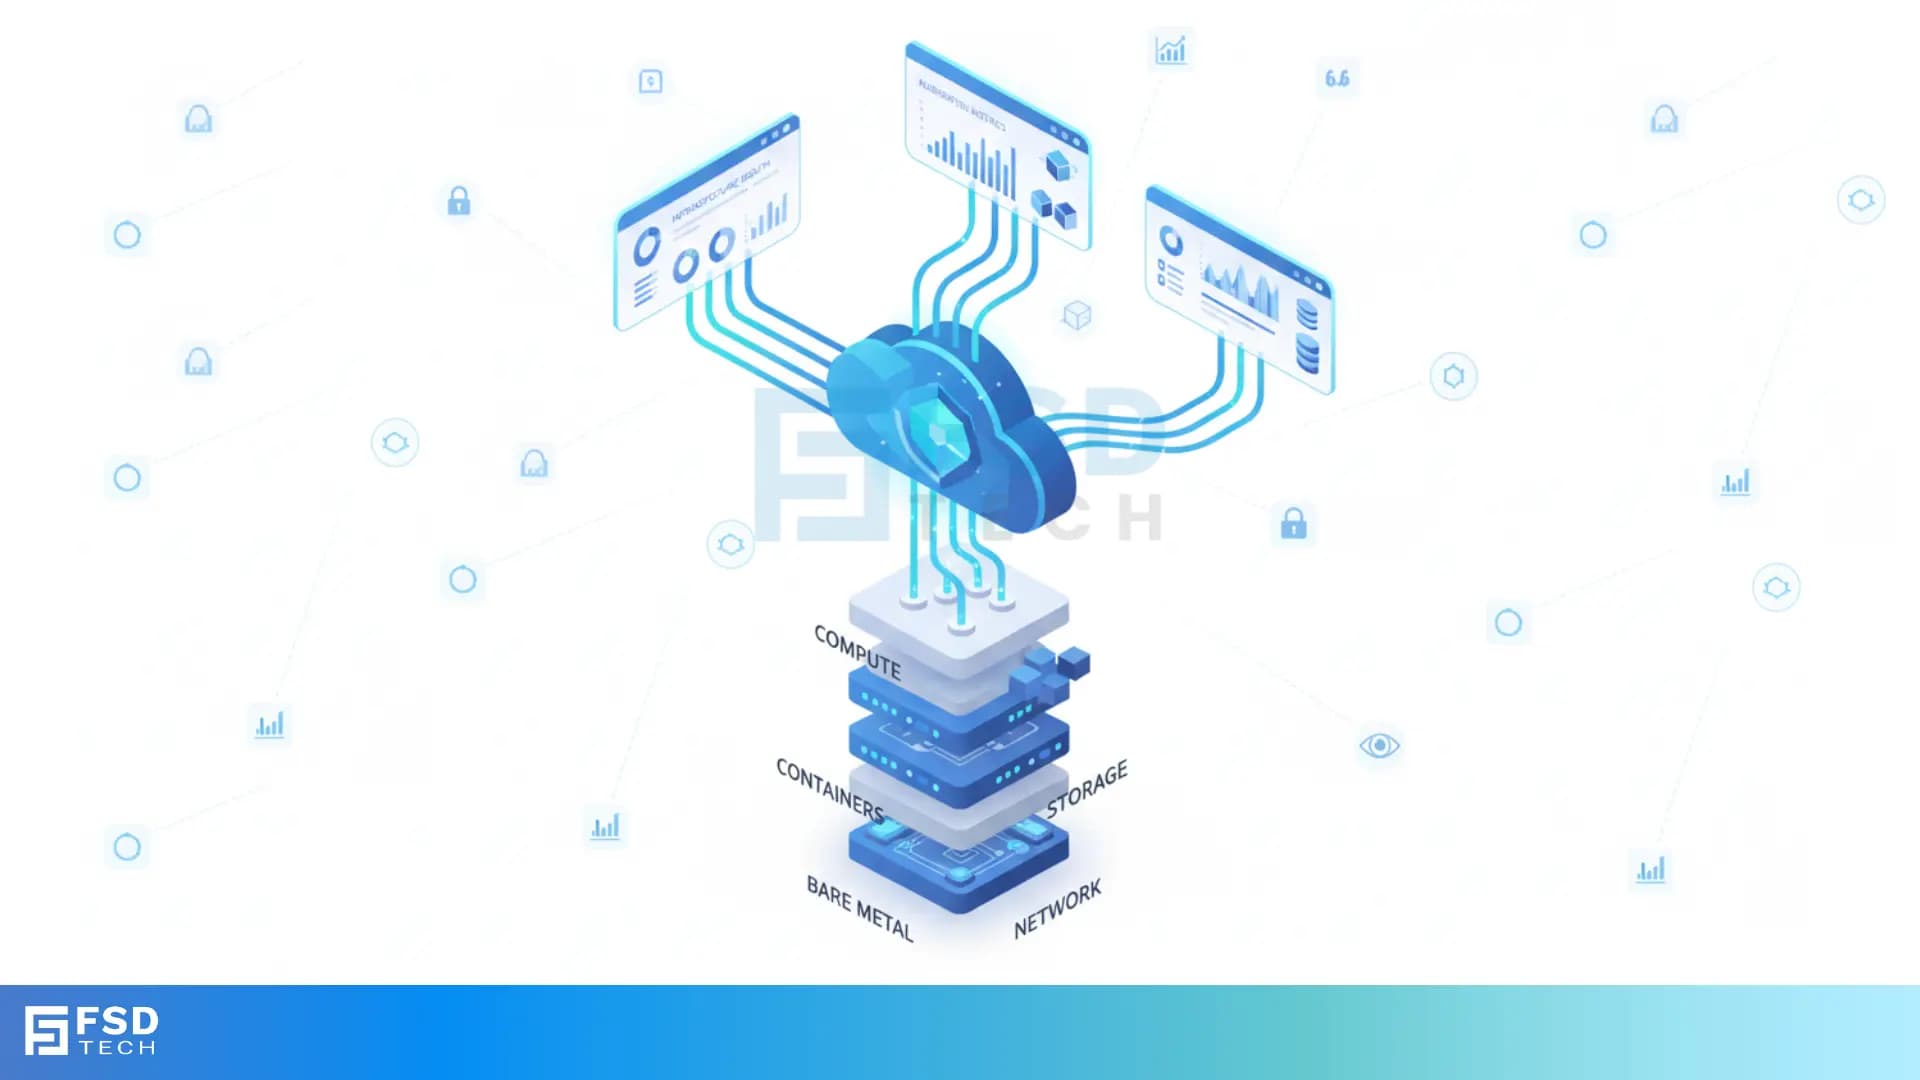
FishOS Health Monitoring provides visibility across all major infrastructure components:
| Layer | Monitored Components |
|---|---|
| Bare Metal | Firmware events, power usage, thermal status |
| Compute | Hypervisors, CPU/memory/disk metrics |
| Containers | Kubernetes pod health, namespace performance |
| Storage | Ceph pool health, IOPS, latency |
| Network | Bandwidth usage, port errors, packet loss |
This comprehensive coverage ensures that all critical layers of your private cloud infrastructure are observed in real time.
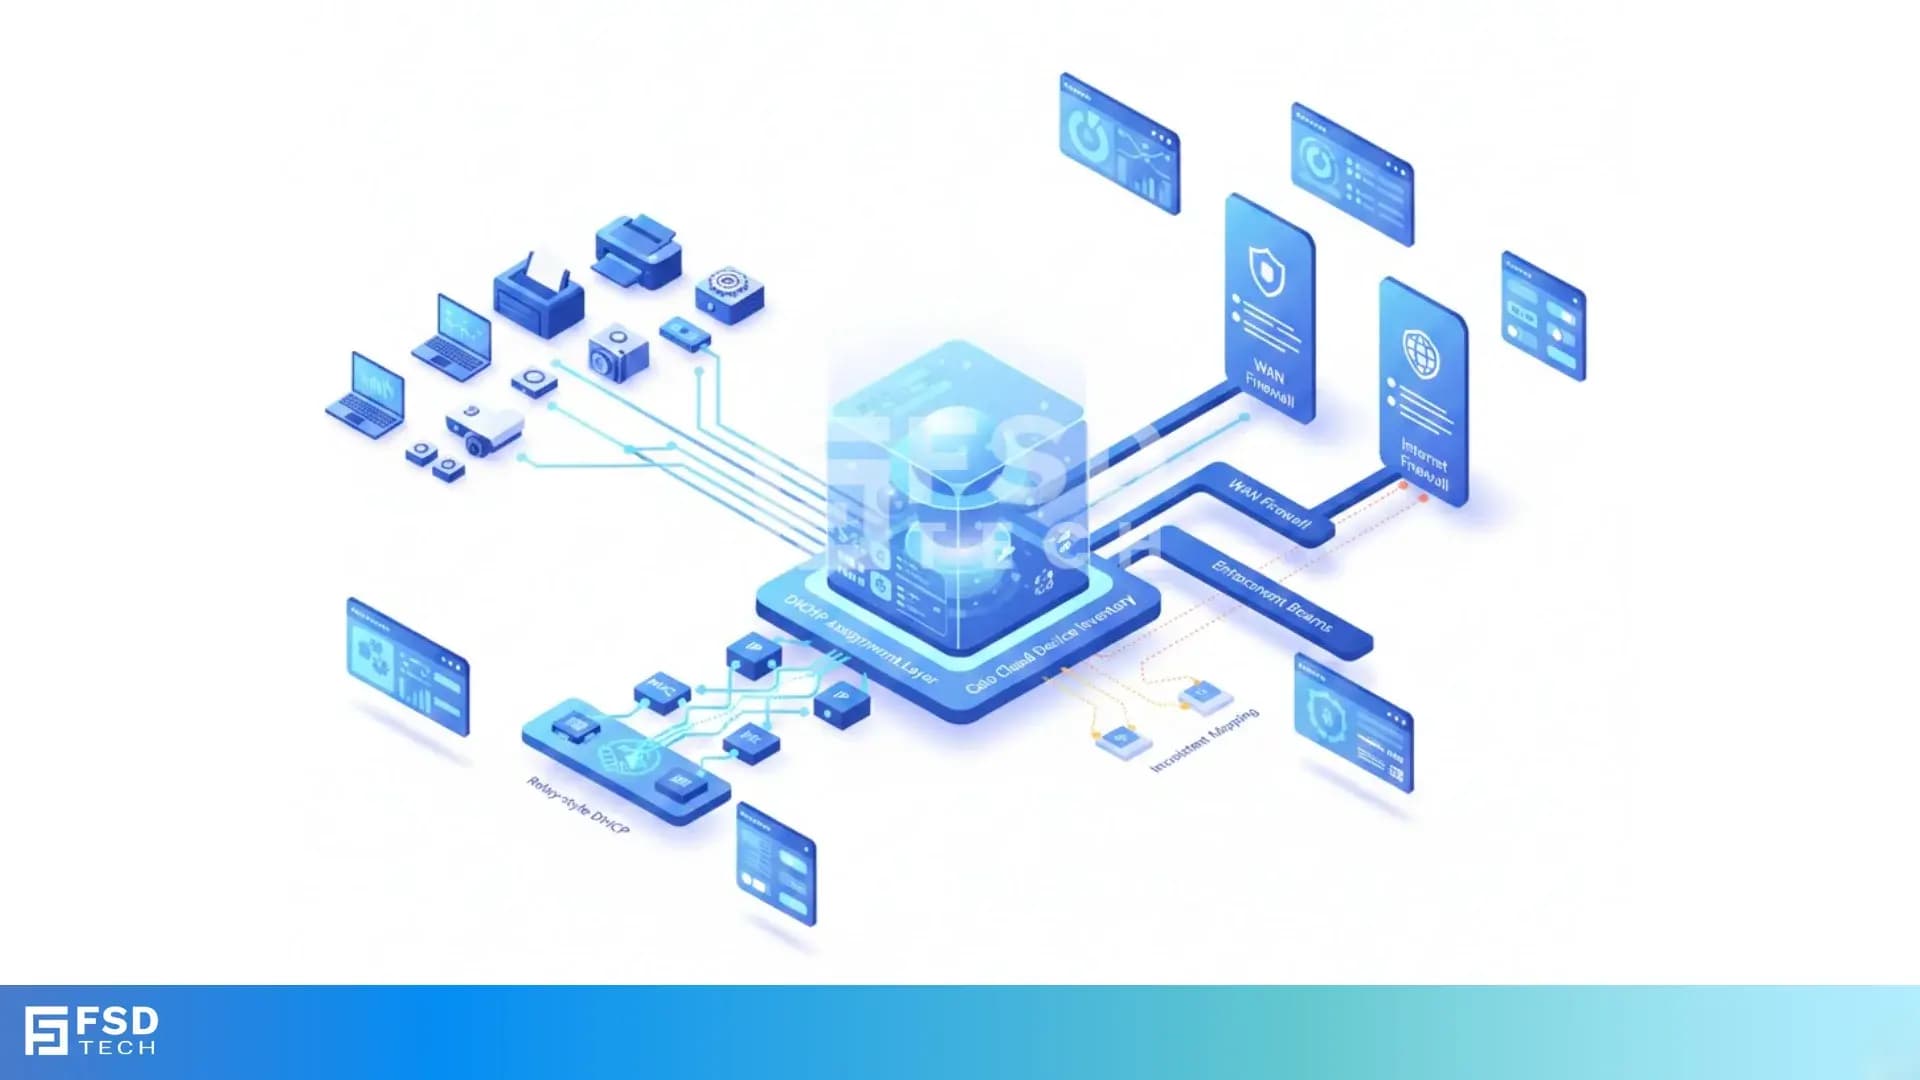
The Health Monitoring Service consolidates logs, metrics, and events from each infrastructure layer into a centralized telemetry pipeline. This pipeline standardizes data, making it possible to:
By centralizing telemetry, FishOS reduces the operational complexity of managing multiple tools and dashboards.
FishOS Health Monitoring includes role-specific dashboards, providing actionable insights for different teams:
| User Role | Dashboard Features | Visual Placeholder |
|---|---|---|
| Admin | Infrastructure-wide health scores, performance trends, capacity usage | ![Admin Dashboard Placeholder] |
| Kubernetes User | Pod-level and namespace health, resource metrics, logs | ![Kubernetes Dashboard Placeholder] |
| Storage Engineer | Ceph pool status, recovery tasks, disk health | ![Storage Dashboard Placeholder] |
Dashboards provide drill-down navigation for fast troubleshooting and real-time monitoring.
Telemetry from Health Monitoring informs Workload Manager and Lifecycle Engine:
This integration ensures that monitoring is not just passive observation but actively informs operational decisions.
Book a free consultation with our experts to explore how FishOS Health Monitoring can reduce downtime, simplify operations, and improve performance in your cloud. Book Now
FishOS monitors bare metal, compute (hypervisors), containers, storage (Ceph), and networking.
No. FishOS provides built-in dashboards, alerts, and integrations. APIs are available for centralized observability if needed.
Yes. Dashboards can be tailored to user roles, thresholds can be configured per SLA or workload type, and alerts can be escalated according to policies.
Yes. Telemetry feeds directly into Workload Manager and Lifecycle Engine, enabling smarter placement and maintenance scheduling.
Yes. Metrics and logs can be retained for audits, reporting, and trend analysis.

Anas is an Expert in Network and Security Infrastructure, With over seven years of industry experience, holding certifications Including CCIE- Enterprise, PCNSE, Cato SASE Expert, and Atera Certified Master. Anas provides his valuable insights and expertise to readers.
Share it with friends!


.webp&w=3840&q=75)
.webp&w=3840&q=75)
share your thoughts