HomeManaged ServicesNext Gen IT-InfraMonitoring & ManagementCyber SecurityBCP / DRAutomation
Managed Services
msp-dubai-accounting-firms-managed-it

Why accounting firms in Dubai need an MSP before they think they do?

🕓 April 24, 2026

How FSD-Tech Deploys Xcitium Managed Security in the GCC

How FSD-Tech Deploys Xcitium Managed Security in the GCC

🕓 May 11, 2026

Cloud Security for GCC Enterprises

Cloud Security for GCC Enterprises: How Xcitium's CNAPP Protects Cloud Investment in 2026

🕓 May 14, 2026

Next Gen IT-Infra
Cato’s SASE Supports Cybersecurity Skills Development

How Cato’s SASE Supports Cybersecurity Skills Development

🕓 April 8, 2025

How SASE Supports the Security Needs of SMBs

How SASE Supports the Security Needs of SMBs

🕓 February 9, 2025

Attack Surface Reduction with Cato’s SASE

Attack Surface Reduction with Cato’s SASE

🕓 February 10, 2025

SASE for Digital Transformation in UAE

SASE for Digital Transformation in UAE

🕓 February 8, 2025

Monitoring & Management
Cost-Performance Ratio: Finding the Right Balance in IT Management Networks

Cost-Performance Ratio: Finding the Right Balance in IT Management Networks

🕓 June 16, 2025

Atera’s Communication Tools

Atera’s Communication Tools: Boosting IT Team Productivity in the UAE

🕓 February 8, 2025

Emerging Trends in IT Management

Emerging Trends in IT Management

🕓 February 10, 2025

Atera Disaster Recovery

Atera Disaster Recovery: Top Strategies for UAE IT Teams

🕓 February 9, 2025

Cyber Security
Illustration of the Cato Cloud architecture showing its role in delivering SASE for secure, optimized global connectivity.

Understanding the Cato Cloud and Its Role in SASE

🕓 January 29, 2025

Isometric illustration of professionals managing network performance, bandwidth analytics, and cloud-based optimization around the Cato Networks platform, symbolizing bandwidth control and QoS visibility.

Mastering Bandwidth Control and QoS in Cato Networks

🕓 July 26, 2025

Global network backbone powering Cato SASE solution for secure, high-performance connectivity across regions.

Global Backbone: The Engine Powering Cato’s SASE Solution

🕓 January 30, 2025

Illustration of team analyzing application traffic and usage insights on a large laptop screen using Cato’s dashboard, surrounded by network and cloud icons.

Cato Networks Application Visibility | Monitoring & Control

🕓 July 27, 2025

BCP / DR
Illustration showing diverse business and IT professionals collaborating with cloud, backup, and security icons, representing Vembu use cases for SMBs, MSPs, and IT teams.

Who Uses Vembu? Real-World Use Cases for SMBs, MSPs & IT Teams

🕓 July 12, 2025

Graphic showcasing Vembu’s all-in-one backup and disaster recovery platform with icons for cloud, data protection, and business continuity for IT teams and SMBs.

What Is Vembu? A Deep Dive Into the All in One Backup & Disaster Recovery Platform

🕓 July 6, 2025

Illustration showing Vembu backup and disaster recovery system with cloud storage, server racks, analytics dashboard, and IT professionals managing data.

The Rising Cost of Data Loss: Why Backup Is No Longer Optional?

🕓 August 14, 2025

3D isometric illustration of cloud backup and data recovery infrastructure with laptop, data center stack, and digital business icons — FSD Tech

RPO & RTO: The Heart of Business Continuity

🕓 August 15, 2025

Automation
Cross-Functional Collaboration with ClickUp

Fostering Cross-Functional Collaboration with ClickUp for Multi-Departmental Projects

🕓 February 11, 2025

ClickUp Project Reporting

Revolutionizing Enterprise Reporting with ClickUp’s Advanced Analytics and Dashboards

🕓 June 16, 2025

ClickUp’s Design Collaboration and Asset Management Tools

Empowering Creative Teams with ClickUp’s Design Collaboration and Asset Management Tools

🕓 February 26, 2025

ClickUp Communication and Collaboration Tools

ClickUp Communication and Collaboration Tools: Empowering Remote Teams

🕓 March 12, 2025

    Subscribe to our newsletter!

    About Us

    Follow Us

    Copyright © 2024 | Powered by 

    Atera

    (60)

    Cato Networks

    (131)

    ClickUp

    (78)

    FishOS

    (7)

    Miradore

    (21)

    PointGuard AI

    (9)

    Vembu

    (28)

    Xcitium

    (37)

    ZETA HRMS

    (79)

    Table of Contents

    How Atera's Alert Management System Works: A Complete Guide for IT Teams

    Anas Abdu Rauf
    July 16, 2025
    Comments
    Visual representation of Atera alert management featuring AI-powered robots, IT devices, and automation icons, symbolizing intelligent incident response and centralized monitoring.

    How does Atera's alert management work?

    Atera's alert management is built around threshold profiles — customizable sets of conditions that trigger alerts when device metrics cross defined levels. Alerts appear on a centralized Alerts page where teams can filter, snooze, resolve, bulk-edit, or convert them into tickets. Auto-healing scripts can run automatically when an alert fires, attempting to fix the issue without technician involvement. AI Copilot (an add-on) can be launched directly from an alert to assist with diagnostics and resolution.

    Why Alert Management Is the Foundation of Proactive IT

    An IT team's ability to respond quickly to problems depends on one thing: knowing about them before users do.


    Alerts are the early warning system for IT infrastructure. When configured well, they surface real problems early and give technicians the information and tools to act. When configured poorly, they create noise, and teams start ignoring them — which is how real issues get missed.


    This guide explains exactly how Atera's alerting system works, from how alerts are created to how they are managed, acted on, and resolved. It also covers the important limitations to understand before you configure your setup.


    All information is drawn directly from Atera's official support documentation and feature pages.


    Reach us for Atera

    How Alerts Work in Atera: The Basics

    Atera monitors all managed devices in real time through agents installed on each endpoint. The Atera agent monitors device availability, performance, and health at regular intervals and reports back to the platform continuously.


    When a metric crosses a configured threshold — or when a specific event occurs — an alert is generated. That alert appears in three places simultaneously:


    • The Atera Dashboard
    • The Alerts page
    • The relevant Agent Console (device view)


    Email notifications and mobile push notifications (via the Atera mobile app) can also be configured so that the right people are notified immediately.

    Threshold Profiles: The Core of Atera's Alert Configuration

    What they are: A threshold profile is a set of conditions that defines which alerts are generated for the devices assigned to that profile. Admins create and assign threshold profiles to specific customers, sites, folders, or individual devices.


    According to Atera's threshold profiles support documentation, each threshold item in a profile can be one of three types:


    • Preset — Standard monitoring items for common events such as software installation, uninstallation, or failed login attempts
    • Custom — Conditions you define by choosing a category, severity level, and specific parameters
    • Script-based — A monitoring script that runs against the device and triggers an alert when the output meets defined conditions

    What Atera's threshold profiles can monitor

    Confirmed from Atera's threshold monitoring support article, the monitoring categories include:


    Performance:

    • CPU load (set percentage and time period; alert includes the top 3 apps causing the issue)
    • Memory usage (alert includes the top 3 apps causing the issue)
    • Network bandwidth (set usage in MB; alert includes the top 3 apps causing the issue)

    Disk:

    • Disk active time (Windows only)
    • Disk space available
    • Disk temperature
    • S.M.A.R.T. monitoring for HDDs and SSDs — detects early signs of drive failure

    Availability:

    • Device online/offline status
    • SNMP device status

    Hardware:

    • Battery health (monitors current maximum capacity on Windows devices)
    • Fan speed
    • Temperature

    Security:

    • Antivirus status (Bitdefender firewall monitoring)
    • Failed login attempts (monitors potential brute force activity; set number of attempts over a time period)

    Exchange (Windows devices):

    • Mailbox size, item count, queue size, storage size, and Exchange service state

    Network:

    • Network bandwidth
    • Windows service status

    Custom events allow teams to create threshold-based monitors for anything not covered by the presets, using script output as the trigger condition.

    Alert severity levels

    Every threshold item is assigned one of three severity levels:


    • Information — low-priority, non-urgent notification
    • Warning — issue developing, attention recommended
    • Critical — immediate action required

    Alert severity cannot be edited after a threshold item is created. To change severity, the item must be recreated.

    Preset threshold templates

    Atera provides preset threshold profile templates for the following device types, ready to assign immediately:


    • Personal Windows computers
    • Windows laptops
    • Windows servers
    • Mac devices
    • Linux machines and servers


    These templates provide a starting point and can be cloned and customized for different environments.


    Also Read: AI Copilot 3.0 and Action Mode: From Recommendations to Fully Autonomous IT

    Auto-Healing Scripts: Automated Alert Resolution

    What they are: Auto-healing scripts are scripts attached to threshold items that run automatically when an alert fires. If the script successfully resolves the underlying issue, the alert is automatically closed — without any technician involvement.


    According to Atera's auto-healing scripts support article: when a monitored threshold is triggered, the attached script runs. If the remediation succeeds, the associated alert is resolved automatically.


    A practical example from Atera's documentation: you can monitor the PrintSpooler service and attach an auto-healing script that automatically restarts the service if it is detected as down. The alert fires, the script runs, the service restarts, and the alert closes — all automatically.

    Key auto-healing script details (verified from Atera's support documentation):

    • Each custom or script-based threshold item can have up to 3 auto-healing scripts attached, which fire in sequence
    • Auto-healing scripts on custom threshold items only execute on Windows and Mac devices. They do not run on Linux devices when the threshold is triggered
    • When an auto-healing script runs, the output is visible on the Alerts page, allowing technicians to see what was attempted
    • If a device is offline when the alert fires, auto-healing scripts will not execute until the device reconnects


    Important Linux limitation: Auto-healing scripts on custom threshold items are not currently supported for Linux devices. Script-based threshold monitoring for Linux was added in Atera's 2025 release, but auto-healing execution on Linux is not currently documented as supported.

    The Alerts Page: Your Central Hub for Alert Management

    What it is: The Alerts page is the central dashboard for all alerts across all monitored devices and customers. It is the primary place for reviewing, managing, and acting on alerts at scale.


    According to Atera's Alerts page support documentation, the page provides:


    • A real-time view of all active alerts across all devices
    • Filtering by status (Open, Snoozed, Resolved), severity, alert category, device type, SNMP type, and customer rank
    • Two display modes: Compact and Detailed row density
    • The ability to save multiple view configurations for different use cases (useful for NOC workflows)
    • Full alert detail including creation time, severity, category, which threshold was crossed, and auto-healing script output


    Also Read: Atera AI Copilot — Redefining Intelligent IT Automation for MSPs

    Actions available from the Alerts page

    ActionWhat It Does
    ResolveMarks the alert as resolved and removes it from the active view
    SnoozePauses the alert notification for 1 hour, 2 hours, 4 hours, 8 hours, 1 day, or 3 days
    DeletePermanently removes the alert
    Create ticketOpens a new ticket linked to the alert
    Assign existing ticketLinks the alert to an open ticket
    Bulk editApply resolve, snooze, or delete to multiple alerts simultaneously
    ExportExport alert data for reporting
    Launch AI CopilotStart an AI-assisted diagnostic session from within the alert (AI Copilot add-on required)

    Bulk edit is available for one alert, multiple selected alerts, or all alerts across the entire page at once — including alerts not currently visible on screen.

    Automatic ticket creation from alerts

    Atera can automatically create a ticket from an alert based on severity. This is configured per site, device, or alert severity level via Admin settings. Automatic ticket creation is controlled by the "Auto Ticket by Severity" setting, which must be enabled globally before per-customer configurations take effect.


    Note: If an alert is snoozed, no ticket will be automatically created until the snooze period expires.

    Snoozing and Pausing Alerts: Important Distinctions

    Atera uses two separate concepts for temporarily suppressing alerts. Understanding the difference is important for configuring your setup correctly.

    Snoozing an alert

    Snoozing applies to a specific alert instance. It pauses the notification for that alert for a selected duration (1 hour, 2 hours, 4 hours, 8 hours, 1 day, or 3 days).


    Critical detail confirmed in Atera's documentation: Snoozing only applies to the specific alert instance and value that was snoozed. If the same condition occurs again — even on the same device — Atera generates a new alert and sends a new notification. Snoozing does not prevent future alerts for the same issue.

    Pausing alerts on a device

    Pausing alerts applies to an entire device and is intended for planned maintenance. When alerts are paused on a device, no alerts are generated for that device for the specified duration. Alerts can be resumed manually before the pause period ends.


    Additional detail: When alerts are paused on an agent device that also monitors non-agent devices (such as printers), alerts on those monitored non-agent devices are paused as well.

    AI Copilot in Alert Management

    What it does: AI Copilot can be launched directly from an alert in Atera's Agent Console. From the alert view, technicians click "Copilot" to start an AI-assisted diagnostic session for that specific device.


    According to Atera's Agent Console support documentation, AI Copilot provides near-instant AI-generated recommendations and solutions directly from the alert context.


    According to Atera's Alerts FAQ: “AI Copilot and Autopilot analyze alert data to automate triage, summarize issues, suggest or execute fixes, and escalate critical problems — reducing MTTR, workload, and risk of missed alerts.”

    What AI Copilot can do from an alert context:

    • Run real-time diagnostics on the device that generated the alert
    • Suggest specific actions based on the alert type and current device state
    • Generate a script to address the issue if a fix requires one
    • Provide context-specific information relevant to the alert type


    Important clarification on AI learning: AI Copilot does not self-learn from your account's historical tickets or alerts over time. It improves only through Atera's own product updates. It operates using the current device context and alert data available in your account at the time of the session — not by training a model on your specific past resolutions.


    AI Copilot is an add-on, not included in Atera's base subscription. A 14-day free trial is available. Contact Atera or your local partner for current pricing.


    Also Read: Mastering Reporting & Analytics in Atera

    Availability Monitoring: A Separate Alert Setting

    What it is: Availability monitoring triggers an alert when a specific device goes offline. This is a separate setting from threshold profiles and must be configured individually per device.


    Key details confirmed from Atera's Remote Monitoring FAQ:


    • Availability monitoring is automatically enabled for Windows Servers and SNMP devices
    • For workstations, availability monitoring must be manually activated on a per-device basis
    • Enabling availability monitoring across all workstations is not recommended — it will generate excessive alerts when end users normally power down their devices
    • Atera's best practice: enable availability monitoring selectively for servers, kiosks, and critical endpoints only

    How to Reduce Alert Fatigue in Atera

    Alert fatigue happens when the volume of notifications makes it difficult to identify what actually needs attention. These practices are based on the capabilities confirmed in Atera's support documentation.

    1. Start with preset templates, then refine

    Assign Atera's preset threshold templates to devices as a starting point. Monitor the alert volume for the first week and identify thresholds that are triggering too frequently for non-critical reasons. Adjust those specific parameters rather than creating everything from scratch.

    2. Set alert severity deliberately

    Every threshold item has a severity level (Information, Warning, Critical) that cannot be changed after creation. Plan severity levels carefully before setting up your profiles. Not every threshold needs to generate a Critical alert. Reserve Critical for conditions that genuinely require immediate response.

    3. Use auto-ticket-by-severity selectively

    Configure automatic ticket creation only for Critical alerts, not for all severities. Information and Warning alerts often do not require a ticket — they may resolve automatically via auto-healing scripts or be handled during the next available maintenance window.

    4. Attach auto-healing scripts to recurring alerts

    For known, repeatable issues — a service that crashes, a disk threshold that frequently triggers due to temporary files — attach an auto-healing script. The script runs automatically when the alert fires, resolves the issue, and closes the alert. Over time, this eliminates the most frequent sources of alert volume.

    5. Pause alerts during planned maintenance

    Before performing maintenance on a device, pause alerts for that device in the Agent Console. This prevents a flood of expected alerts from filling the dashboard during scheduled work.

    6. Use saved views on the Alerts page

    Create and save filtered views on the Alerts page for different purposes — for example, a view showing only Critical alerts, or a view filtered by a specific customer. Saved views support NOC-style workflows and help teams focus on what is relevant to their current task.

    7. Remember the snooze limitation

    Snoozing an alert pauses that specific instance only. If the same condition triggers a new alert, the new alert will generate a notification. If a threshold is generating repeated alerts that you do not want to act on immediately, consider adjusting the threshold itself rather than continuously snoozing.

    Key Takeaways on Atera Alert Management

    • Atera's alerting system is built around threshold profiles with three item types: preset, custom, and script-based.
    • Alert severity has three levels: Information, Warning, and Critical. Severity cannot be edited after a threshold item is created — it must be recreated.
    • Up to 3 auto-healing scripts can be attached to each custom threshold item, running in sequence when the alert fires.
    • Auto-healing scripts on custom threshold items only execute on Windows and Mac devices — not Linux devices.
    • Snoozing an alert pauses only that specific alert instance. New triggers for the same condition generate new alerts and notifications.
    • Windows Event Log alerts do not auto-resolve and must be manually resolved by a technician.
    • AI Copilot can be launched directly from an alert in the Agent Console. It does not self-learn from historical account data — it improves through Atera's product updates only.
    • AI Copilot is an add-on, not included in Atera's base subscription.
    • Availability monitoring for workstations must be enabled per device and is not recommended for all devices.

    Frequently Asked Questions (FAQs) on Atera Alert Management

    What is a threshold profile in Atera?

    A threshold profile is a customizable set of conditions that determines which alerts are generated for the devices assigned to it. Profiles can include preset, custom, and script-based threshold items across categories including performance, disk, hardware, security, Exchange, and network. Atera provides preset profile templates for Windows PCs, Windows laptops, Windows servers, Macs, and Linux devices.


    How do auto-healing scripts work in Atera?

    Auto-healing scripts are attached to threshold items and run automatically when the alert fires. If the script successfully resolves the underlying issue, the alert closes automatically. Up to 3 scripts can be attached to each threshold item. Auto-healing scripts on custom threshold items currently only execute on Windows and Mac devices — not Linux devices.


    What is the difference between snoozing and pausing alerts in Atera?

    Snoozing applies to a specific alert instance. It pauses notification for that instance for a selected duration (up to 3 days), but if the same condition triggers a new alert, a new notification is sent. Pausing applies to an entire device and stops all alert generation for that device for the specified period — typically used during planned maintenance.


    Do Windows Event Log alerts auto-resolve?

    No. Unlike threshold-based alerts (such as CPU or RAM), Windows Event Log alerts do not have a reset state and must be manually resolved by a technician. This is confirmed in Atera's Alerts FAQ.


    Can alerts automatically create tickets in Atera?

    Yes. Atera can automatically create tickets from alerts based on alert severity. This is configured per site, device, or severity level. Automatic ticket creation requires the "Auto Ticket by Severity" setting to be enabled globally in Admin settings first. If an alert is snoozed, no ticket will be created until the snooze expires.


    Does AI Copilot learn from my historical alert data?

    No. AI Copilot does not self-learn from your account's historical tickets or alerts. It operates using current device context and available account data at the time of the session. It improves only through Atera's own product updates.


    Is AI Copilot included in all Atera plans?

    No. AI Copilot is an add-on, not included in Atera's base subscription. A 14-day free trial is available. Contact Atera or your local partner for current pricing.


    What actions can I take from the Alerts page?

    From the Alerts page, you can resolve, snooze, or delete alerts individually or in bulk. You can create new tickets or assign existing ones to alerts. You can filter by severity, status, category, device type, and customer rank. You can export alert data and save multiple view configurations. AI Copilot can be launched from the Agent Console view of a specific alert.

    Conclusion

    A well-configured alert system is one of the most practical things an IT team can build. It shifts the team from reactive support to proactive management — catching problems before they affect users and resolving common issues automatically.


    Atera's alerting tools give IT teams precise control over what gets flagged, how it gets handled, and who gets notified. Threshold profiles define the conditions. Auto-healing scripts handle the resolution automatically when possible. The Alerts page gives teams the visibility and bulk-action tools to manage alert volume without getting overwhelmed.


    Understanding the limitations — the snooze scope, the Linux auto-healing restriction, the Windows Event Log manual resolution requirement — is just as important as understanding the capabilities. Getting those details right at the start prevents confusion later.


    For IT teams and MSPs in the GCC region, FSD-Tech is a certified Atera partner that deploys and supports the platform locally.


    Talk to an Atera Specialist Today


    How Atera's Alert Management System Works: A Complete Guide for IT Teams

    About The Author

    Anas Abdu Rauf

    Anas is an Expert in Network and Security Infrastructure, With over seven years of industry experience, holding certifications Including CCIE- Enterprise, PCNSE, Cato SASE Expert, and Atera Certified Master. Anas provides his valuable insights and expertise to readers.

    TRY OUR PRODUCTS

    Like This Story?

    Share it with friends!

    Subscribe to our newsletter!

    FishOSCato SASEVembuXcitiumZeta HRMSAtera
    Isometric illustration of a centralized performance platform connected to analytics dashboards and team members, representing goal alignment, measurable outcomes, risk visibility, and strategic project tracking within ClickUp.

    How ClickUp Enables Outcome-Based Project Management (Not Just Task Tracking)

    🕓 February 15, 2026

    Isometric illustration of a centralized executive dashboard platform connected to analytics panels, performance charts, security indicators, and strategic milestones, representing real-time business visibility and decision control within ClickUp.

    Executive Visibility in ClickUp – How CXOs Gain Real-Time Control Without Micromanaging

    🕓 February 13, 2026

    Cato SASE Architecture

    Inside Cato’s SASE Architecture: A Blueprint for Modern Security

    🕓 January 26, 2025

    Workflow Automation(8)

    Workforce Automation(1)

    AI Project Management(1)

    HR Data Automation(1)

    RMM(2)

    Firewall Security(1)

    IT Workflow Automation(1)

    IT security(2)

    GCC compliance(4)

    Payroll Integration(2)

    IT support automation(3)

    procurement automation(1)

    lost device management(1)

    IT Management(5)

    IoT Security(3)

    Cato XOps(1)

    IT compliance(5)

    Task Automation(1)

    Workflow Management(1)

    Kubernetes lifecycle management(2)

    OpenStack automation(1)

    AI-powered cloud ops(1)

    SMB Security(8)

    Data Security(1)

    MDR (Managed Detection & Response)(3)

    MSP Automation(3)

    Atera Integrations(2)

    Threat Detection & Response(1)

    XDR Security(2)

    Ransomware Defense(3)

    SMB Cyber Protection(1)

    HR Tech Solutions(1)

    Zero Trust Network Access(3)

    Quantum Threat UAE & GCC(1)

    Quantum Security(1)

    Post-Quantum Cryptography(1)

    Cloud IDE Security(1)

    Zero Trust Security(2)

    Endpoint Management(1)

    SaaS Security(2)

    Payroll Automation(5)

    IT Monitoring(2)

    Xcitium EDR SOC(15)

    Ransomware Protection GCC(1)

    M&A IT Integration(1)

    Network Consolidation UAE(1)

    MSSP for SMBs(1)

    SMB Cybersecurity GCC(1)

    Antivirus vs EDR(1)

    FSD-Tech MSSP(25)

    Ransomware Protection(3)

    Managed EDR FSD-Tech(1)

    Endpoint Security(1)

    Cybersecurity GCC(16)

    Data Breach Costs(1)

    Endpoint Protection(1)

    SMB Cybersecurity(8)

    Managed Security Services(2)

    Zero Dwell Containment(31)

    Xcitium EDR(30)

    Hybrid Backup(1)

    Cloud Backup(1)

    Backup & Recovery(1)

    pointguard ai(4)

    vembu(9)

    disaster recovery myths(1)

    backup myths(1)

    SMB data protection(9)

    Disaster Recovery(4)

    Vembu BDR Suite(19)

    DataProtection(1)

    GCCBusiness(1)

    Unified Network Management(1)

    GCC IT Solutions(1)

    Secure Access Service Edge(4)

    GCC HR software(20)

    open banking(1)

    financial cybersecurity(2)

    CC compliance(1)

    Miradore EMM(15)

    Government Security(1)

    Cato SASE(9)

    Cloud Security(9)

    Hybrid Learning(1)

    GCC Education(1)

    Talent Development(1)

    AI Cybersecurity(13)

    AI Compliance(2)

    AI Risk Management(1)

    AI Governance(4)

    AI Security(2)

    Secure Remote Access(1)

    GCC business security(1)

    GCC network integration(1)

    compliance automation(5)

    education security(1)

    GCC cybersecurity(3)

    Miradore EMM Premium+(5)

    App management UAE(1)

    BYOD security Dubai(8)

    share your thoughts

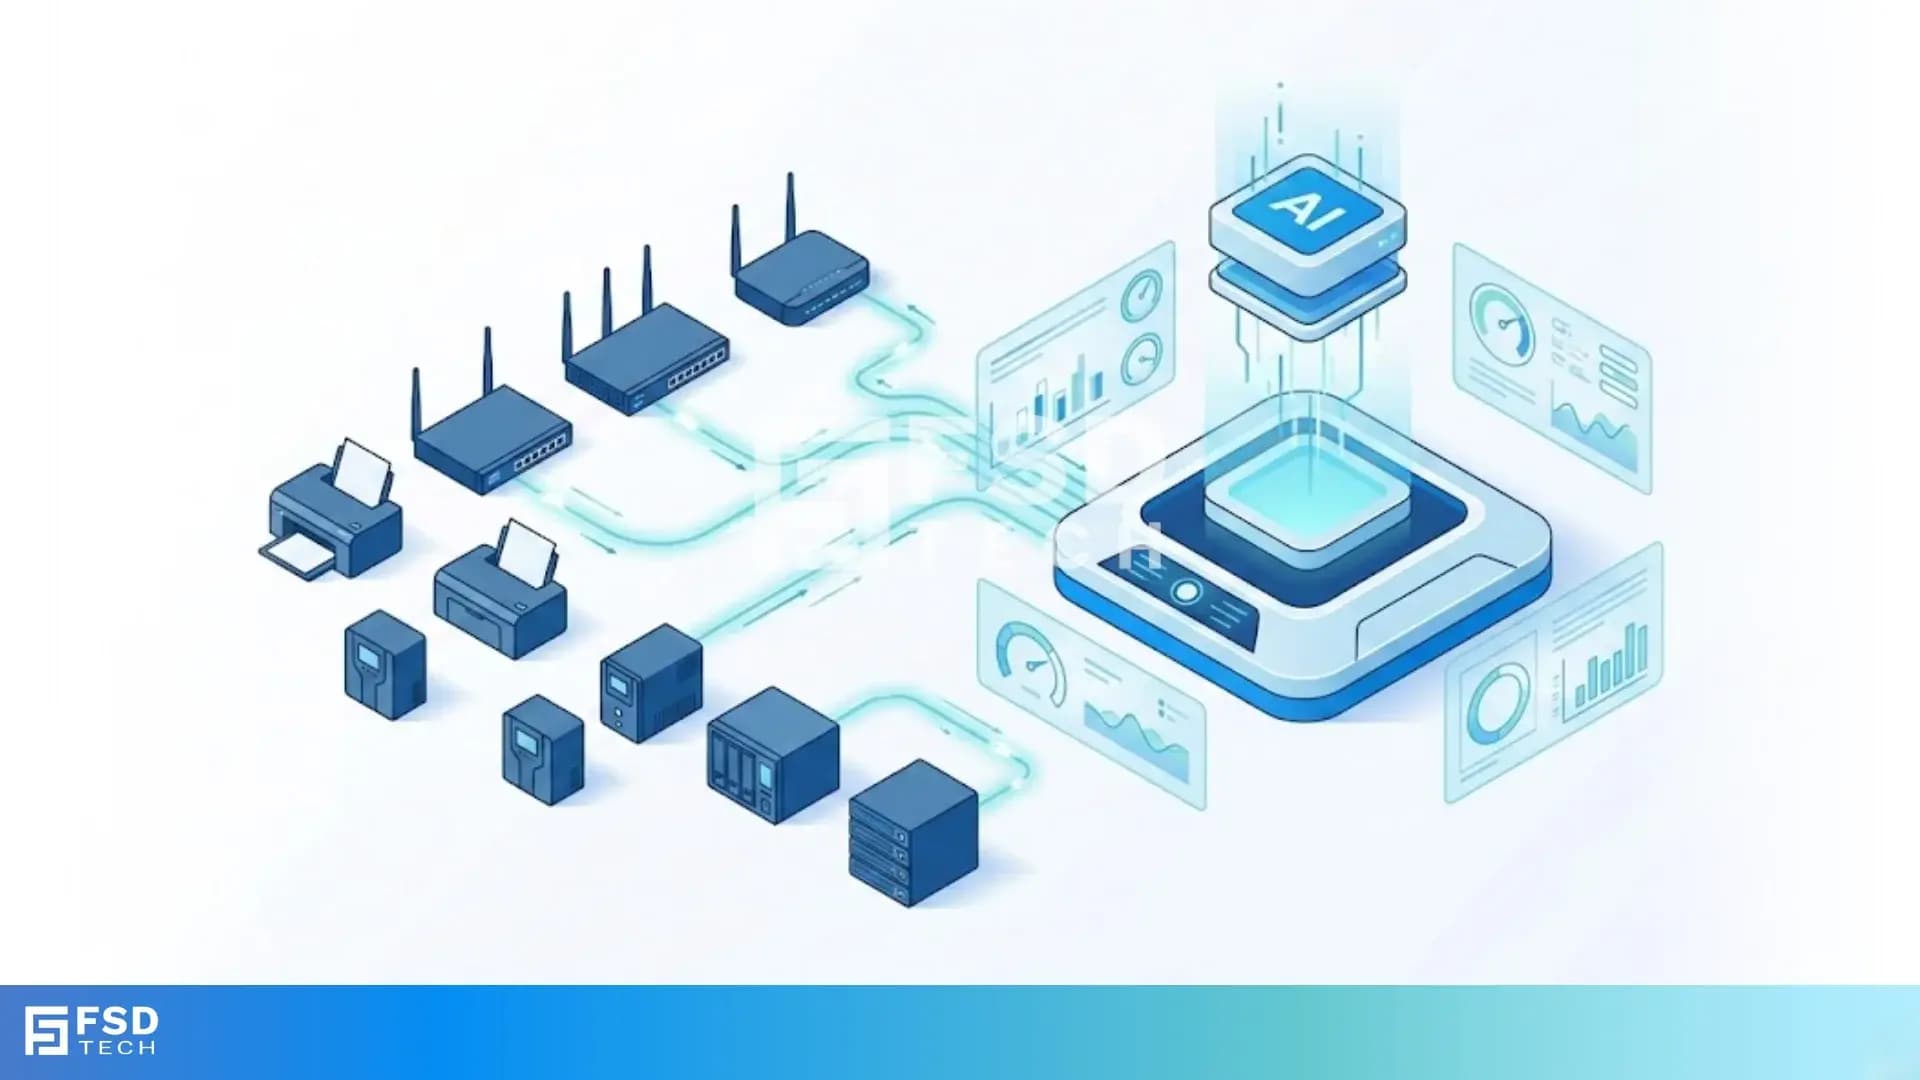
    Isometric illustration showing network infrastructure devices like routers, switches, printers, and servers connected to an AI-powered monitoring platform, representing SNMP-based infrastructure visibility and data analysis.

    Seeing Beyond Endpoints: How Atera SNMP Monitoring Extends Visibility Across Network Infrastructure

    🕓 March 25, 2026

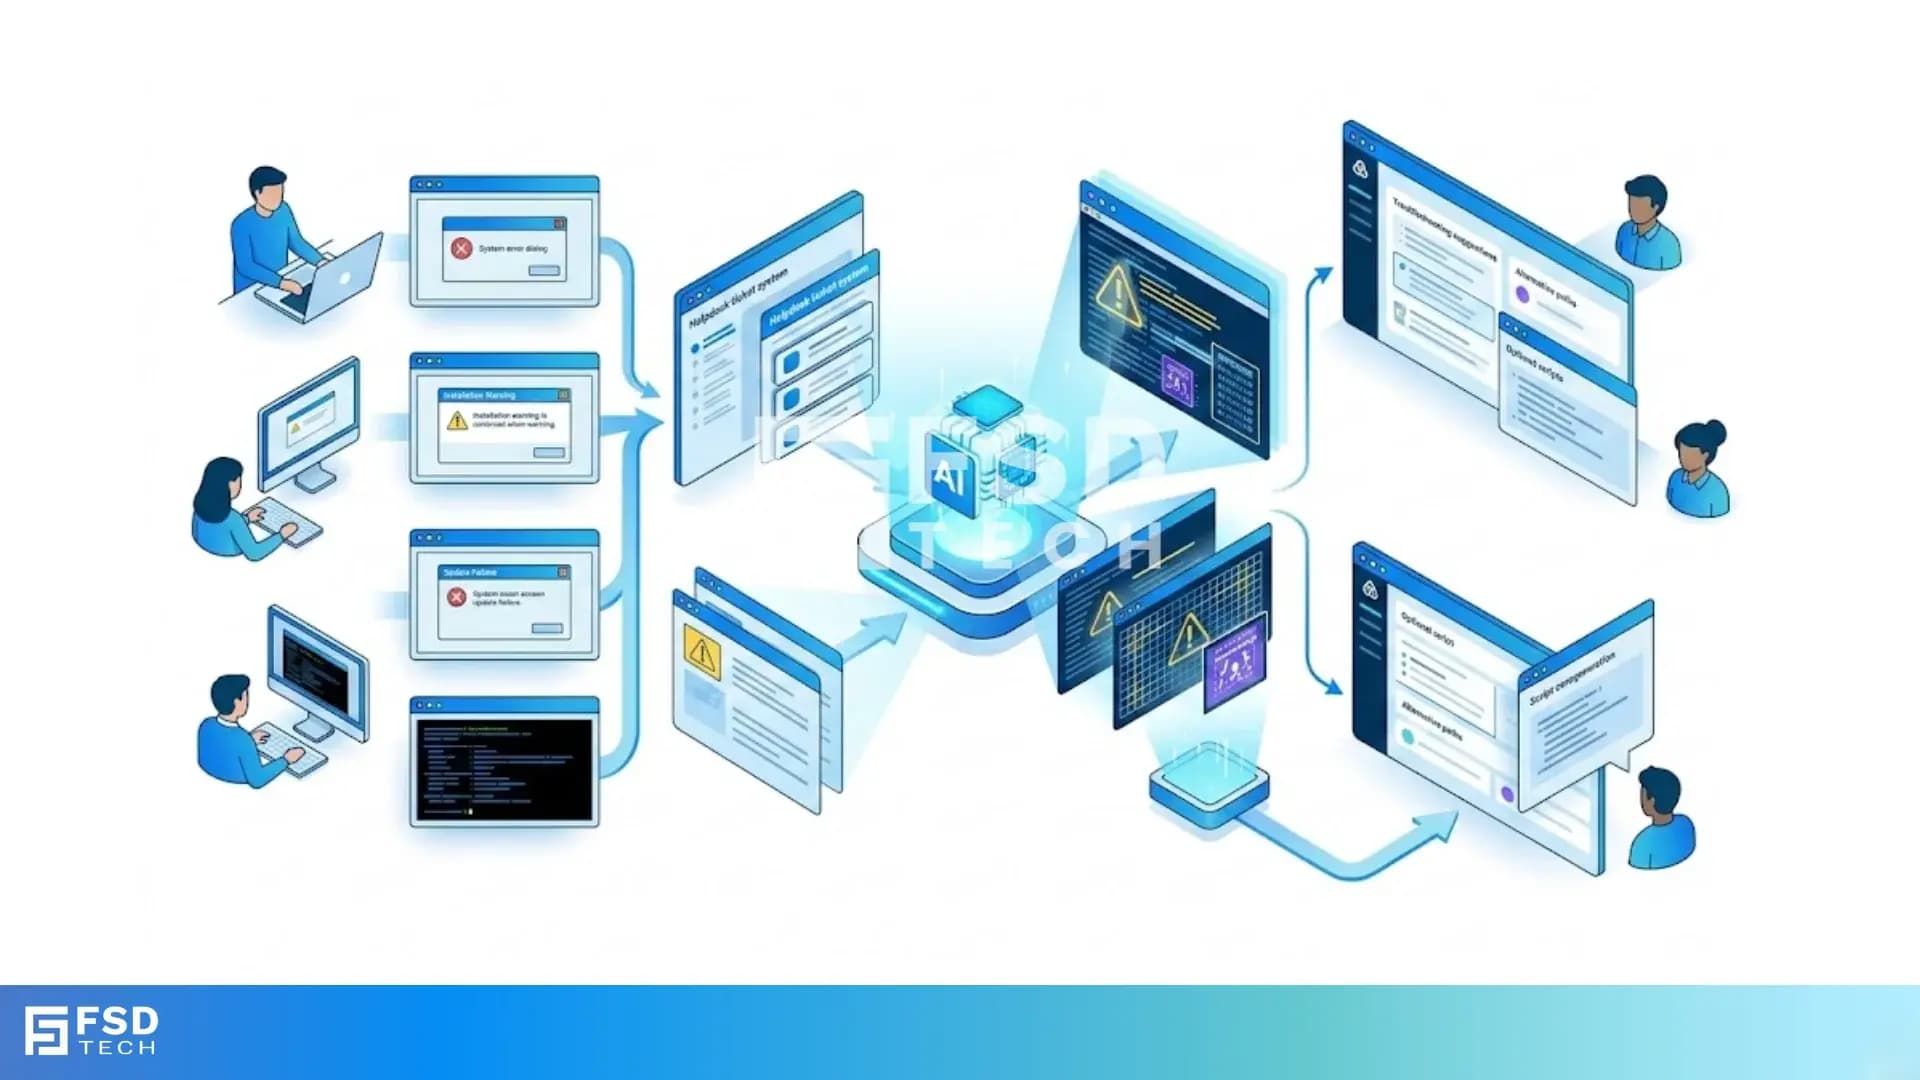
    Isometric diagram illustrating Atera AI Copilot analyzing screenshots, system errors, and warning messages to assist IT teams with faster troubleshooting, root cause analysis, and remediation guidance.

    When a Screenshot Explains More Than a Ticket: How Atera AI Copilot Image Analysis Supports Faster Troubleshooting

    🕓 March 22, 2026

    hIsometric diagram illustrating Atera AI Copilot supporting persistent AI conversations and multi-chat workflows, helping IT teams analyze infrastructure data, maintain troubleshooting context, and manage multiple technical investigations simultaneously.

    Conversations That Continue: How Atera AI Copilot Multi-Chat Improves IT Troubleshooting Context

    🕓 March 20, 2026

    Managed Services(3)

    Decoded(247)

    Cyber Security(129)

    BCP / DR(28)

    Zeta HRMS(78)

    SASE(21)

    Automation(80)

    Next Gen IT-Infra(128)

    Monitoring & Management(81)

    ITSM(22)

    HRMS(21)

    Automation(24)